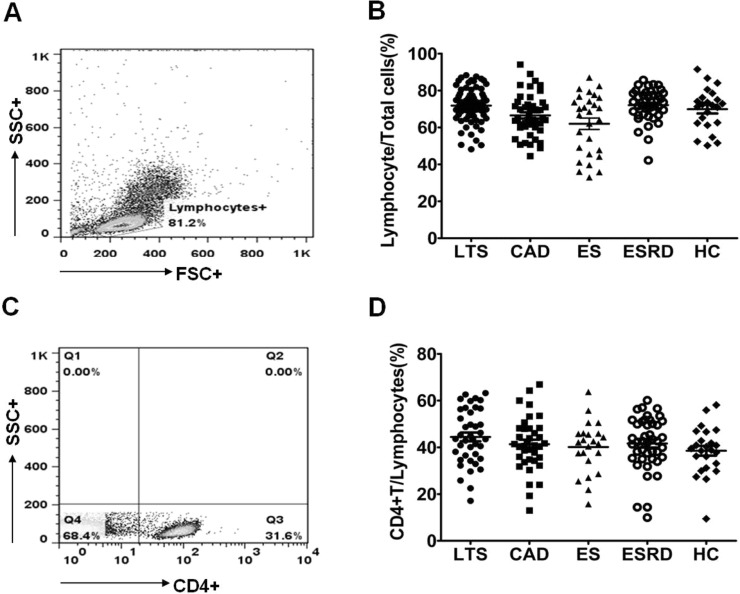
Fig 2. Distribution of lymphocyte and CD4+ T cell in each patient group.
PBMC from each patient group were stimulated for 4h ex vivo with PMA and ionomycin in the presence of Golgi Stop. The percentage of target cells was measured by flowcytometry. (A) The representative figure of flowcytometric analysis for lymphocyte and CD4+ T cell. (B) The proportion (%) of Lymphocyte/Total cells and (C) CD4+ T/Lymphocyte cells in each group. * P<0.05 for each comparison. LTS, long term stable; CAD, chronic allograft dysfunction; ES, early stable; ESRD, end stage renal disease; HC, healthy control.

