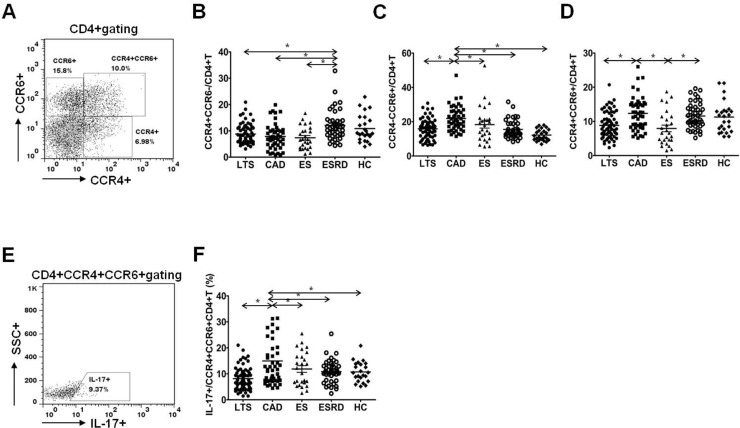
Fig 5. Distribution of chemokine receptor CCR4+CCR6–, CCR4–CCR6+ and CCR4+CCR6+ subpopulations of CD4+ T lymphocytes.
(A) PBMCs were stained with anti-CD4 PE-cy7, anti-CCR4 PE, anti-CCR6 APC and anti-IL-17 FITC. CD4+ T cells were gated for further analysis. (B) The proportion (%) of CCR4+CCR6–/CD4+ T cells (C) CCR4–CCR6+/CD4+ T cells (D) CCR4+CCR6+/CD4+ T cells in each patient group. (E) After surface staining with anti-CD4, CCR4 and CCR6 mAbs, analysis of IL-17 in CD4+ T cell subsets by intracellular flow cytometry was done. (F) The proportion (%) of IL-17+/CCR4+CCR6+CD4+ T cells in each patient group. * P<0.05 for each comparison. LTS, long term stable; CAD, chronic allograft dysfunction; ES, early stable; ESRD, end stage renal disease; HC, healthy control.

