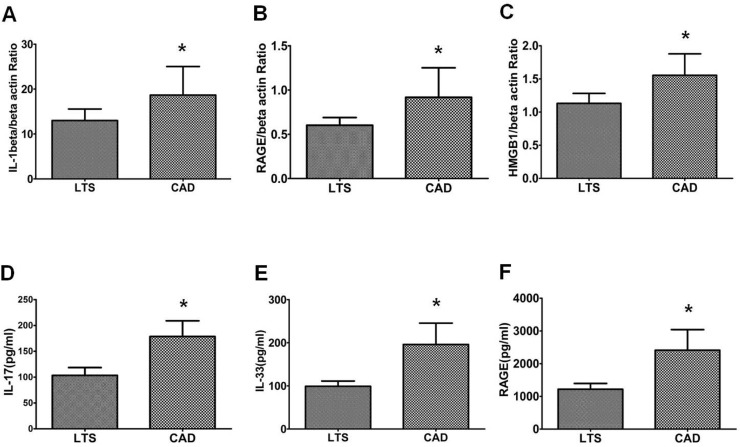
Fig 6. Expression of Th17 pathway molecules and serum Th17 associated cytokine level in LTS and CAD group.
The expression of (A) IL-1beta (B) RAGE (C) HMGB1 mRNA was measured using real-time PCR. In addition, concentrations of (D) IL-17 (E) IL-33 and (F) RAGE were determined using ELISA in the serum of LTS and CAD patient group. Bars show the means. * P<0.05 vs. LTS. CAD, chronic allograft dysfunction; LTS, long term stable.

