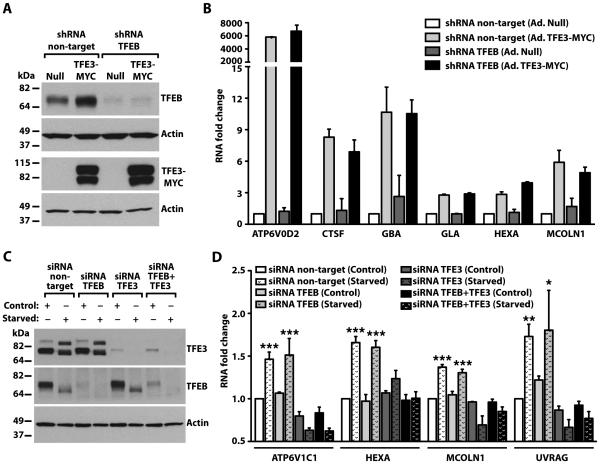
Fig. 6. TFE3 promotes expression of lysosomal genes independently of TFEB.
(A) Immunoblotting analysis of control (Null) or TFEB-depleted HeLa cells infected with Null- or TFE3-MYC-expressing adenoviruses for 48 hours. Protein bands were detected with antibodies against TFEB and MYC (used to detect endogenous TFEB and TFE3-MYC, respectively), and Actin. Data are representative of 3 independent experiments. (B) qRT-PCR analysis of lysosomal genes from HeLa cells treated as indicated in (A). Total RNAs were extracted and mRNA transcript abundance was assessed using specific primers for the indicated genes. Data were normalized to Glyceraldehyde 3-phosphate dehydrogenase (GAPDH). Bars represent fold change of the ratio to shRNA non-target cells infected with adenovirus Null. Values are presented as average ± range of 2 independent experiments. (C) Immunoblotting analysis of ARPE-19 cells treated with siRNA to TFEB, TFE3, or TFEB and TFE3 (TFEB+TFE3) under control or starvation conditions. Proteins were detected with antibodies against TFEB, TFE3, and Actin. Note that the immunoblot for endogenous TFEB required a much longer exposure time due to the very low abundance of TFEB in ARPE-19 cells compared to the abundance of endogenous TFE3. Data are representative of 3 independent experiments (D) qRT-PCR analysis of lysosomal- or autophagy-related genes from ARPE-19 cells treated as indicated in (C). Total RNAs were extracted and mRNA transcript abundance was assessed using specific primers for the indicated genes. Bars represent fold change of the ratio to siRNA non-target cells in control condition. Values are means ± SD of 3 independent experiments. The data were analyzed using one-way ANOVA (*, p ≤ 0.05; **, p ≤ 0.01; ***, p ≤ 0.001 versus siRNA non-target control cells).

