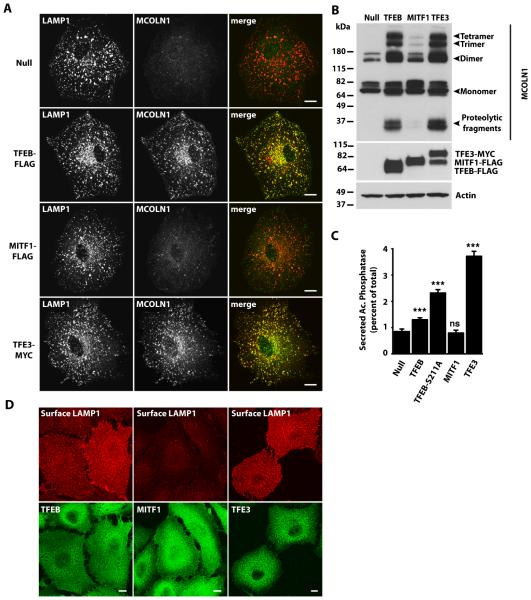
Fig. 7. TFE3 overexpression triggers lysosomal exocytosis.
(A) Immunofluorescence confocal microscopy analysis of endogenous MCOLN1 in ARPE-19 cells infected with Null adenovirus or adenovirus expressing TFEB-FLAG, MITF1-FLAG, or TFE3-MYC for 40 hours. Cells were double stained with antibodies against MCOLN1 and LAMP1. Scale bars, 10 μm. Data are representative of 3 independent experiments and over 90% of cells exhibited the phenotypes shown. (B) Immunoblotting analysis of ARPE-19 cells overexpressing adenovirus Null, TFEB-FLAG, MITF1-FLAG, or TFE3-MYC. Proteins were detected with antibodies against MCOLN1, MYC (to detect TFE3), FLAG (to detect TFEB and MITF1), and Actin. Data are representative of 3 independent experiments. (C) Acid phosphatase secretion analysis in HeLa cells infected with adenoviruses expressing the indicated proteins. Bars represent the secreted acid phosphatase activity as a percentage of the total acid phosphatase activity. Values are means ± SD of 3 independent experiments. The data were analyzed using one-way ANOVA (***, p ≤ 0.001; ns: not significant versus Null-infected cells). (D) Immunofluorescence confocal microscopy analysis of LAMP1 present at the cell surface of ARPE-19 cells overexpressing TFEB-FLAG, MITF1-FLAG, or TFE3-MYC. Cells were double stained with antibodies against FLAG and MYC (used to detect TFEB-FLAG, MITF-FLAG, and TFE3-MYC, respectively) and LAMP1. Scale bars, 10 μm. Data are representative of 3 independent experiments and over 90% of cells exhibited the phenotypes shown.

