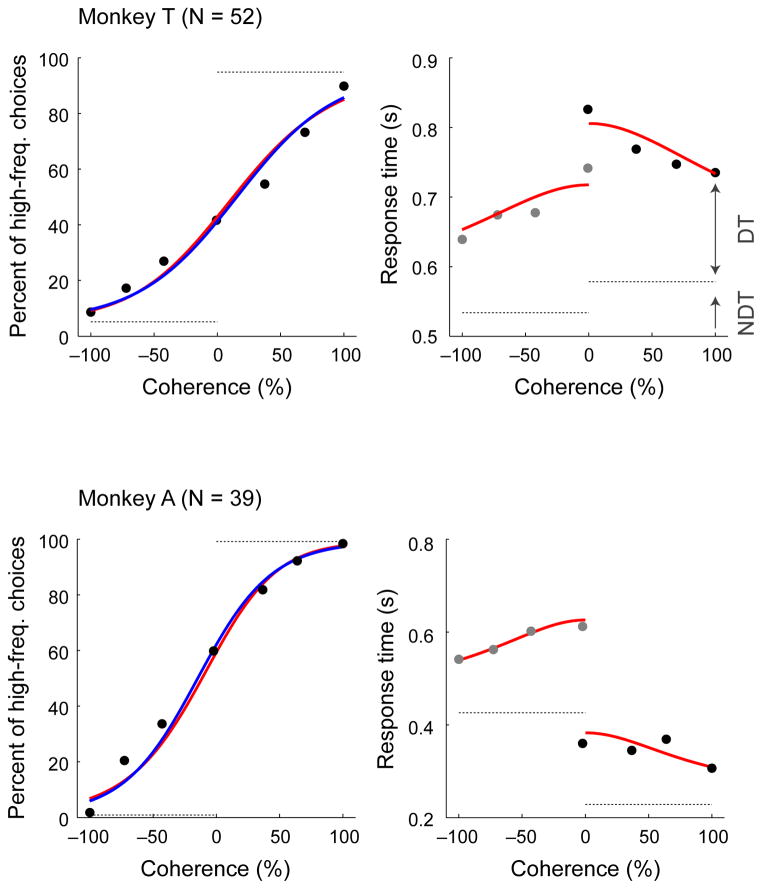
Figure 2. Psychophysical performance on the low-high task.
Psychometric (left) and chronometric (right) functions for Monkey T (top) and Monkey A (bottom). Psychometric functions are plotted as the percentage of trials in which monkey chose “high frequency” as a function of signed coherence, where larger negative/positive coherence values indicate more low/high frequency tone bursts. The horizontal dashed grey lines on the psychometric plots indicate lapse rate (errors for strong stimuli, presumably reflecting lapses in attention or inappropriate application of the decision-motor mapping, which were estimated from logistic-model fits indicated as solid blue curves). Chronometric functions are plotted as the mean RT, which was the time interval between stimulus onset and onset of joystick movement, on correct trials as a function of signed coherence. Grey dots are low-frequency choices, and black dots are high-frequency choices. Solid red curves are simultaneous fits of both psychometric and chronometric data to a drift-diffusion model (DDM)18–20, 29–33. The horizontal dashed grey lines on the chronometric plots indicate choice-dependent non-decision times (NDT) estimated by the DDM fits. Decision times (DT) were estimated as the difference between the trial-specific RT and the choice-specific NDT.

