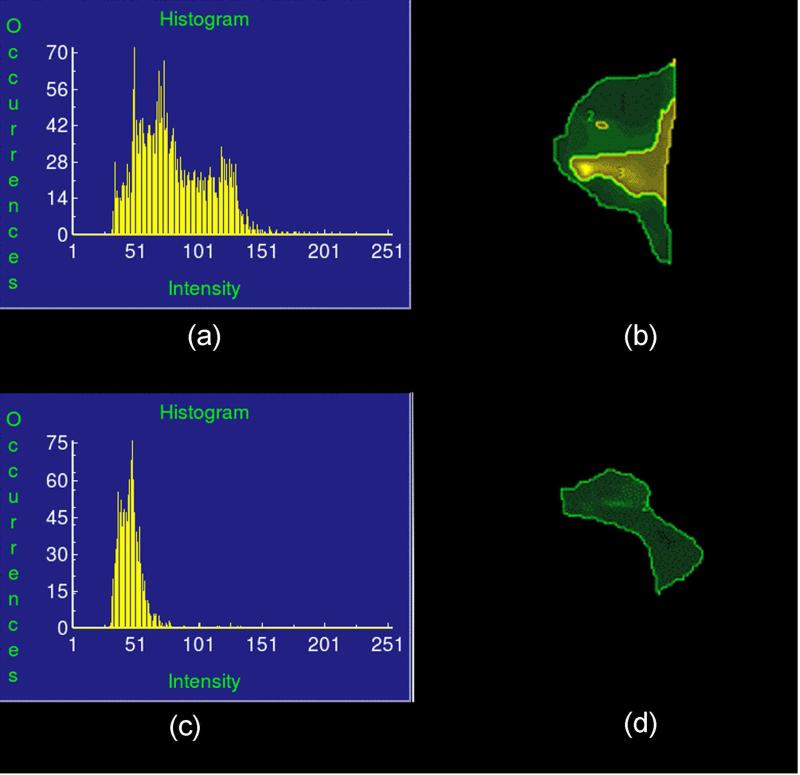
Figure 3.
The automated thresholding process (ANALYZE®, Mayo Clinic, Rochester, MN) to determine the three maximum-likelihood thresholds that divide the stiffness range into four statistically significant classes.
(a) Histogram of a typical case with taut band region and surrounding normal tissue region divided by the thresholding algorithm.
(b) The division of stiffness classes in the region of interest for (a).
(c) Histogram of a typical case which no threshed can be identified in the region of interest (ROI) that divides the stiffness range into any statistically significant classes.
(d) The division of stiffness classes in the region of interest for (c). Based on the thresholding process, the whole ROI is one single class (excluding the image background), thus a homogenous region.

