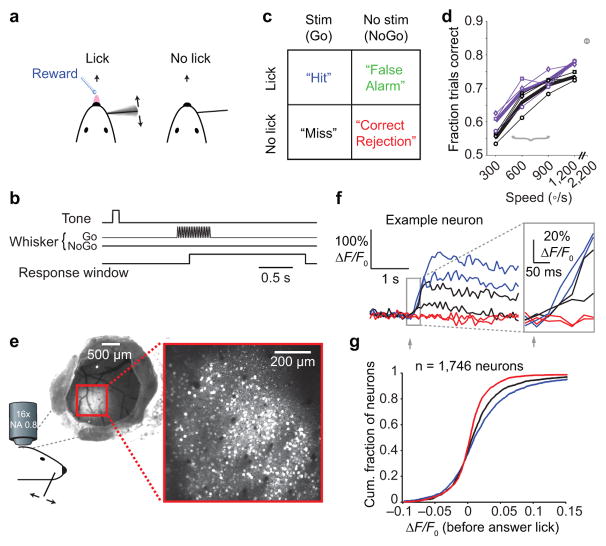
Figure 1. Choice-related activity in mouse primary somatosensory cortex.
(a) Tactile detection task based on deflections of a single whisker. (b) Trial structure. A tone alerted mice to the time of possible stimulus onset. On Go trials, the whisker was stimulated with a sinusoidal deflection (0.5 s, 20 or 40 Hz). Mice responded by licking or not licking within a 1.8 s response window. (c) Four trial types are possible, based on the stimulus condition (present/absent) and the response (lick/no lick). (d) Behavioral detection performance varied with deflection speed for a single whisker (thin black lines) and three whiskers deflected simultaneously (thin purple lines). Plot symbols indicate different mice (n = 3). Thick lines show mean performance across mice for deflection of one (black) or three (purple) whiskers. Gray plot symbol at top-right shows performance (n = 2 mice) with strong multi-whisker stimulation. Gray bracket indicates range of speeds used for electrophysiology and imaging experiments. (e) Two-photon calcium imaging of primary somatosensory (S1) cortex during the tactile detection task. Left: cranial window showing region expressing the genetically encoded calcium indicator GCaMP6s. Right: example two-photon image over S1 showing hundreds of individual layer 2/3 neurons (white). (f) Example activity (ΔF/F0) traces from a single neuron for two Hit (blue), two Miss (black) and two Correct Rejection (red) trials. Inset: early portion of traces, before the earliest behavioral reaction times, used to calculate “evoked” ΔF/F0. (g) Cumulative histograms showing mean ΔF/F0 for Hit (blue), Miss (black) and Correct Rejection (red) trials for each neuron (n = 1,746 neurons from 6 mice).

