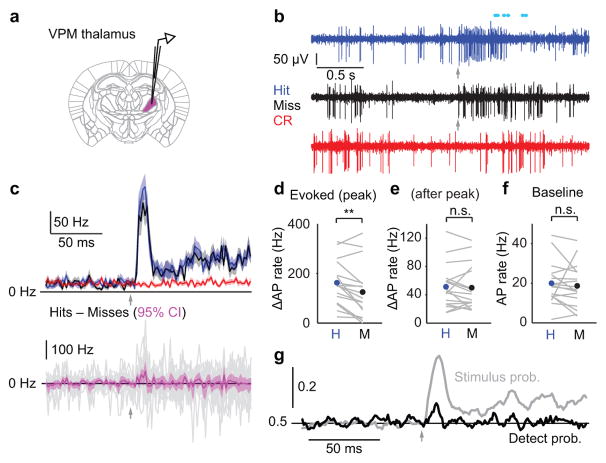
Figure 3. Transient choice-related activity in VPM thalamus.
(a) Schematic of extracellular recording in the ventral posteromedial nucleus of thalamus (VPM). (b) Example traces for Hit (blue), Miss (black) and Correct Rejection (red) trials. Arrows: stimulus onset. Cyan circles: licking. (c) Top: mean PSTHs (2 ms bins; ± SEM) for n = 17 recordings. Bottom: mean of differences between Hit and Miss PSTHs for each neuron (magenta; mean ± 95% confidence interval). Gray traces: individual recordings. Arrows: stimulus onset. (d) Evoked AP rate is higher for Hit trials compared with Miss trials during a transient (10 ms) window at the peak of the response (p = 0.0065, n = 17). (e) Evoked AP rate after the peak of the response showed no difference for Hit and Miss trials (p = 0.63, two-tailed sign test, n = 17). (f) Pre-stimulus AP rate is similar for Hit and Miss trials (p = 0.14, two-tailed sign test, n = 17). (g) Mean time course of detect probability (black) and stimulus probability (gray) across all VPM recordings. Arrow: stimulus onset. n.s., p > 0.05; **, p < 0.01.

