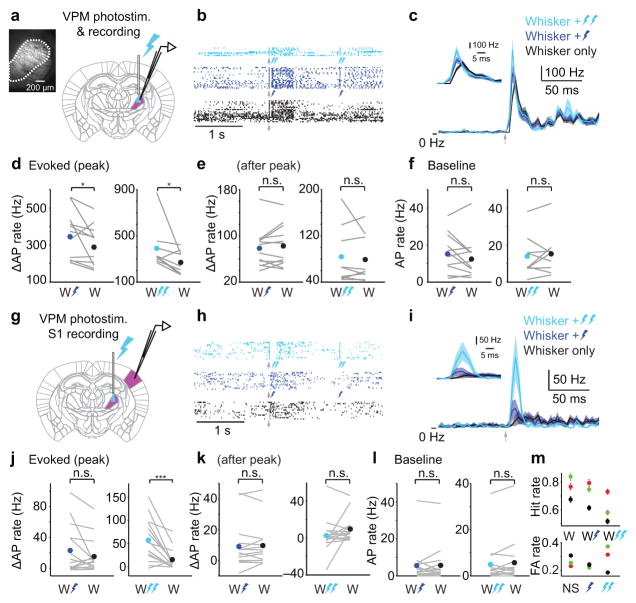
Figure 4. Brief cortical response to transient VPM activity.
(a) Schematic of simultaneous optogenetic stimulation and extracellular recording in VPM. Fluorescence image shows channelrhodopsin-2 expression (white) in VPM (dashed outline). (b) Example spike rasters from a VPM recording with whisker stimulation alone (black ticks) or whisker stimulation plus weak (dark blue) or strong (light blue) photostimulation. Arrow: whisker stimulus onset. Dark blue bolt: weak photostimulation. Double light blue bolts: strong photostimulation. Responses to light alone are shown toward the end of the rasters (bolts in the dark blue and light blue rasters). (c) Mean PSTHs (4 ms bins; ± SEM) for whisker-alone (n = 12), whisker plus weak light (n = 12) or whisker plus strong light (n = 9). Inset: zoomed view. Arrow: onset of whisker stimulus followed by light pulse (0–4 ms delay; Methods). (d) Evoked AP rate in a transient (10 ms) window at the peak of the whisker-evoked response is higher for whisker stimulation (“W”) plus photostimulation (dark blue bolt, weak light: p = 0.039, two-tailed sign test, n = 12; double light blue bolts, strong light: p = 0.039, two-tailed sign test, n = 9) compared with whisker stimulation alone. (e) Evoked AP rate after the peak of the whisker-evoked response showed no differences between whisker-alone and whisker plus photostimulation (weak light: p = 0.57, n = 12; strong light: p = 1.0, two-tailed sign test, n = 9). (f) Pre-stimulus AP rate is similar for trials with whisker-alone vs whisker plus photostimulation (weak light: p = 0.34, n = 12; strong light, p = 0.57, n = 9). (g) Schematic of simultaneous optogenetic stimulation in VPM and cell-attached recording in S1. (h) Example spike rasters from an S1 recording. Conventions as in (b). (i) Mean PSTH (4 ms bins; ± SEM) for n = 15 recordings. Inset: zoomed view. Arrow: onset of whisker stimulus followed by light pulse (4 ms delay; Methods). (j) Evoked AP rate for whisker stimulation alone compared with whisker stimulation plus photostimulation (weak light: p = 0.61, two-tailed sign test, n = 15; strong light: p < 1e–3, n = 15). Whisker-alone data are the same in the left and right panels. (k) Evoked AP rate after the peak of the whisker-evoked response showed no differences between whisker-alone and whisker plus photostimulation (weak light: p = 0.54, n = 15; strong light: p = 0.42, two-tailed sign test, n = 15). (l) Pre-stimulus AP rate is similar for trials with whisker-alone vs whisker plus photostimulation (weak light: p = 0.71, n = 15; strong light: p = 0.36, n = 15). (m) Behavioral Hit (top) and False Alarm (bottom) rates for three mice (colors) obtained during experiments in (g–l). NS: no stimulus. Symbols show mean performance (± bootstrap SEM) of trials pooled across 5–6 sessions per mouse. n.s., p > 0.05; *, p < 0.05; ***, p < 0.001.

