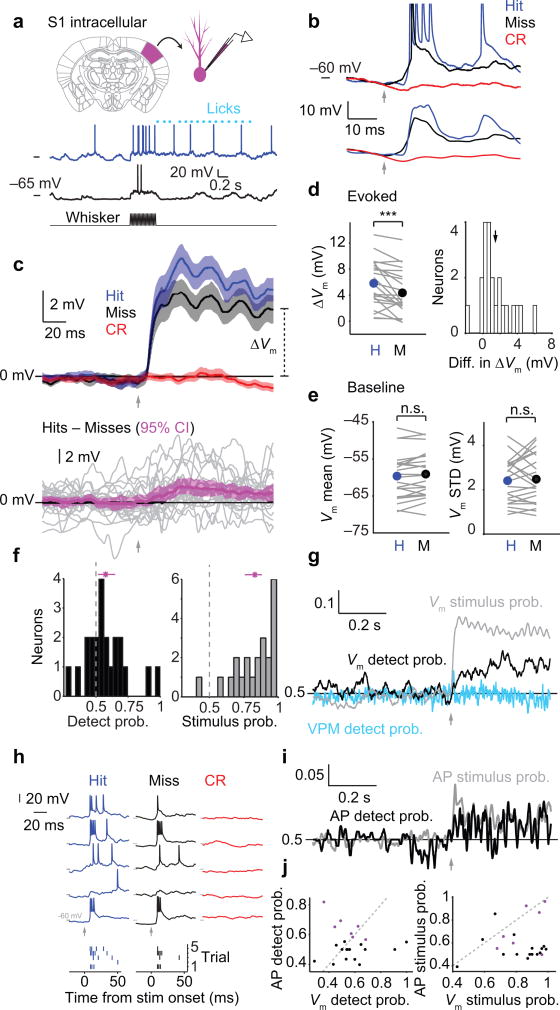
Figure 5. Choice-related membrane potential dynamics in S1 cortex.
(a) Top: Schematic of intracellular (whole cell) recording in primary somatosensory (barrel) cortex. Bottom: Example membrane potential (Vm) traces for Hit (blue) and Miss (black) trials. (b) Removing spikes from Vm traces. Top: example raw Vm traces; action potentials (APs; shown truncated) are evident in the Hit and Miss trials. Bottom: the same Vm traces after median filtering and smoothing to eliminate APs. Arrows: stimulus onset for Hit and Miss traces. (c) Top: Mean Vm change after AP removal (± SEM; n = 22 neurons) for Hit (blue), Miss (black) and Correct Rejection (red) trials. Bottom: Mean of differences between mean Vm on Hits and mean Vm on Misses (magenta; mean ± 95% confidence interval; n = 22 neurons). Gray traces: individual recordings. (d) Left: Stimulus-evoked change in membrane potential (ΔVm) is larger on Hit trials compared with Miss trials (p < 1e–3, two-tailed sign test, n = 22). Right: Histogram of the mean difference in ΔVm between Hits and Misses for each neuron (arrow: mean at 1.4 mV). (e) Pre-stimulus membrane potential dynamics are similar for Hit and Miss trials, both mean Vm (p = 0.13, n = 22) and standard deviation of Vm (p = 0.64). (f) Histograms of detect probability (black) and stimulus probability (gray) computed from ΔVm. Magenta: means ± 95% confidence intervals. (g) Mean time course of detect probability (black) and stimulus probability (gray) across Vm recordings (n = 22). VPM detect probability is shown for comparison (cyan, same data as in Fig. 3g). (h) Extracting action potential times from Vm traces. Top: Example Vm traces from an S1 neuron for Hits, Misses and Correct Rejections. Bottom: action potential rasters obtained from the example traces. (i) Mean time course of detect probability and stimulus probability calculated using action potential times instead of Vm, across the top third of neurons ranked by DP (n = 7, corresponding to purple plot symbols in panel (j)). (j) Left: detect probability calculated for each neuron using either action potential rate (y-axis) or evoked change in membrane potential (x-axis). Right: stimulus probability calculated for each neuron using either action potential rate or evoked change in membrane potential. Neurons that did not spike had y-axis values set to 0.5. Purple symbols: neurons included in traces in (i). n.s., p > 0.05; ***, p < 0.001.

