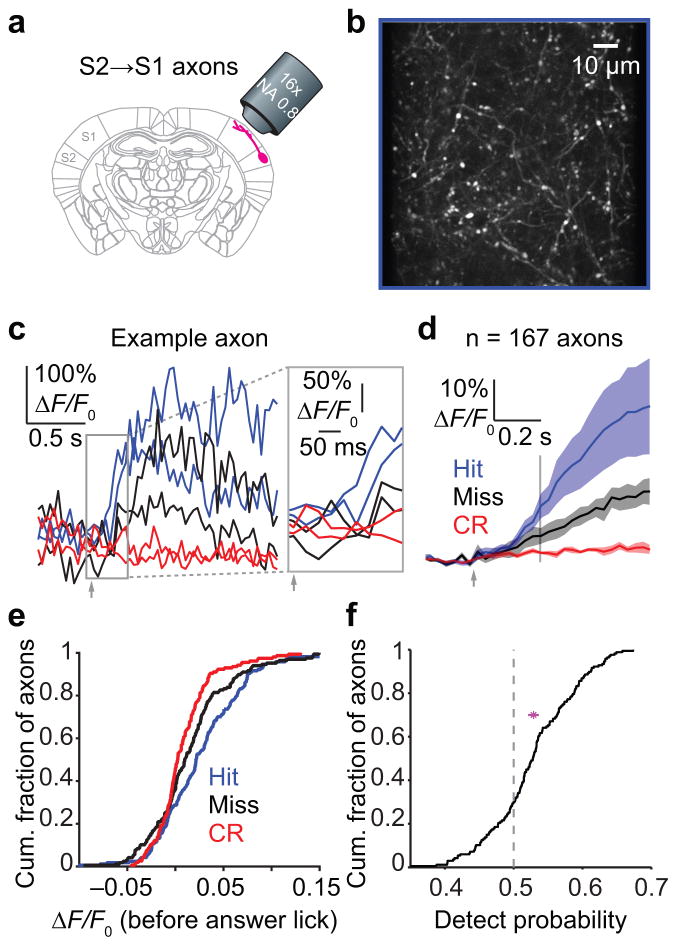
Figure 6. Feedback of choice-related activity from S2 to S1.
(a) Schematic of two-photon imaging in S1 from top-down axons projecting from S2 to S1 (S2→S1 axons). (b) Example two-photon image from layer 1 of S1 showing S2→S1 axons (white). (c) Example activity (ΔF/F0) traces from a single axon for two Hit (blue), two Miss (black) and two Correct Rejection (red) trials. Inset: early portion of traces, before the earliest behavioral reaction times, used to calculate evoked ΔF/F0. (d) Mean ΔF/F0 activity time series (± SEM across 4 mice, n = 167 axons total) for each trial type. Vertical line: end of period used for analysis (before the answer lick). (e) Cumulative histograms showing mean ΔF/F0 for Hit, Miss and Correct Rejection trials for each axon (Hits vs Miss: p = 0.0078, K-S test, n = 167 axons from 4 mice). (f) Detect probability for S2→S1 axons. Dashed line: chance level, 0.5. Magenta: mean ± 95% confidence interval ([0.516, 0.534]; n = 167 axons from 4 mice).

