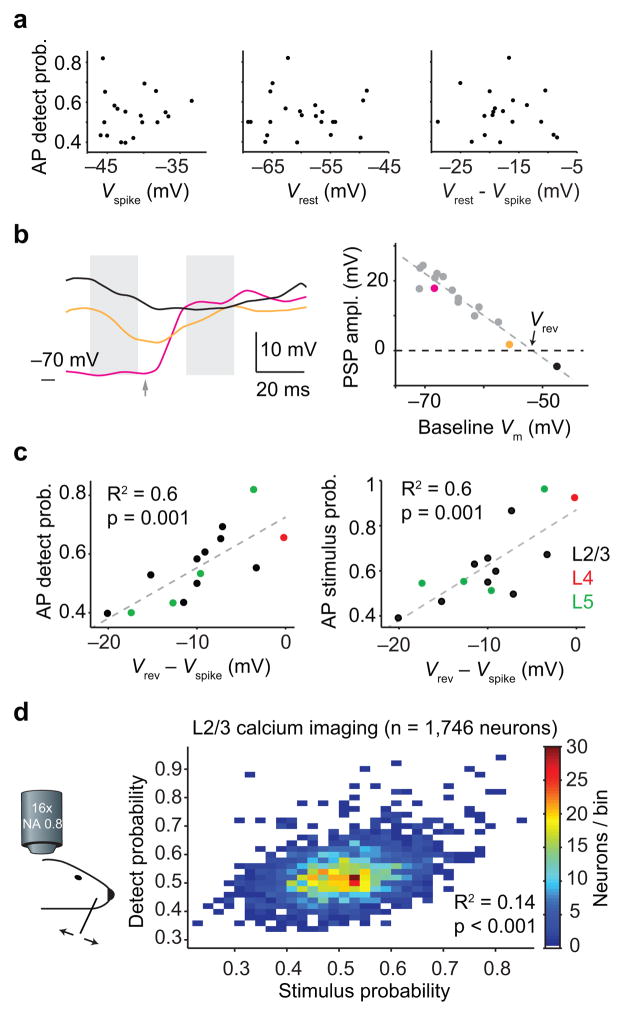
Figure 7. Intracellular stimulus sensitivity predicts choice-related spiking.
(a) Biophysical properties related to excitability, including spike threshold (Vspike), resting membrane potential (Vrest) or their difference, do not explain the magnitude of detect probability. (b) Example reversal potential (Vrev) calculation. Vrev quantifies the relationship between the amplitude of stimulus-evoked postsynaptic potentials and pre-stimulus membrane potential. Left: example traces of Vm. Gray shading indicates windows used to measure pre-stimulus Vm and evoked PSP (arrow: stimulus onset). Right: PSP amplitude plotted against pre-stimulus Vm shows a linear relationship. Reversal potential, Vrev, is defined as the pre-stimulus Vm that produces a zero amplitude PSP. Vrev for this neuron is −51.8 mV. Magenta, yellow and black points correspond to traces in left panel. (c) Spike rate detect probability (left) and stimulus probability (right) are strongly correlated with the difference between reversal potential and spike threshold (R2 = 0.6, p = 0.001). Plot symbol color indicates nominal cortical layer (estimated by depth). (d) Detect probability and stimulus probability tend to be higher in the same neurons. Two-dimensional histogram showing correlated detect and stimulus probability (R2 = 0.14, p < 1e–3) across populations of S1 layer 2/3 neurons (n = 1,746 neurons from 6 mice).

