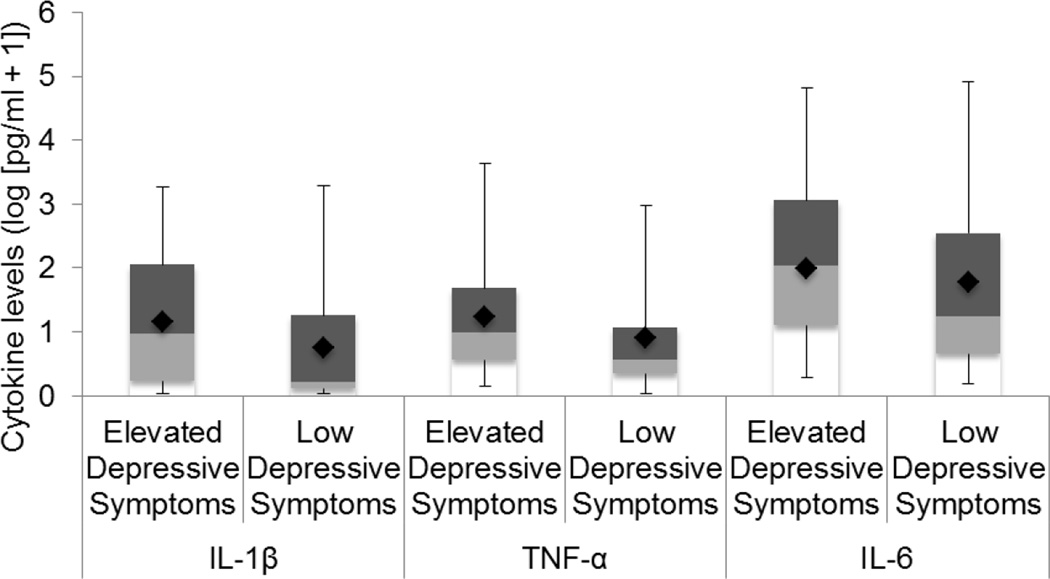
Figure 1. Group Differences on Levels of Pro-Inflammatory Cytokines.
Box and whisker plots with cytokine levels reflecting unadjusted data values are represented as log(pg/ml+1). Each plot represents raw data values in quartiles including minimum values (limit of lower whisker), median values (cutoff between lower and upper boxes), and maximum values (limit of upper whisker). Diamonds represent means of cytokines adjusted for study covariates.

