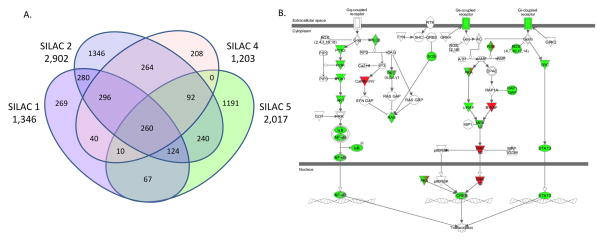
Figure 2.
Reproducibility and coverage of the MC3T3-E1 osteoblast phosphoproteome. A) Four-way Venn diagram depicting the number of SILAC phosphopeptide pairs identified in each of the four biological replicate experiments. Of 4,720 unique phosphopeptide pairs, 260 were observed in all four experiments, 522 in three of four experiments, 924 in at least two experiments, and 3,014 in a single experiment. Regulated phosphopeptides, defined as those with BH corrected p value <0.1 and n≥2 observations, were used in subsequent analyses. B) Observed (green) and regulated (red) phosphoproteins were overlaid on the IPA canonical GPCR signaling pathway network. Symbols with both colors, e.g. PKA and PDE, represent multi-subunit proteins in which at least one subunit contained a regulated site of phosphorylation.

