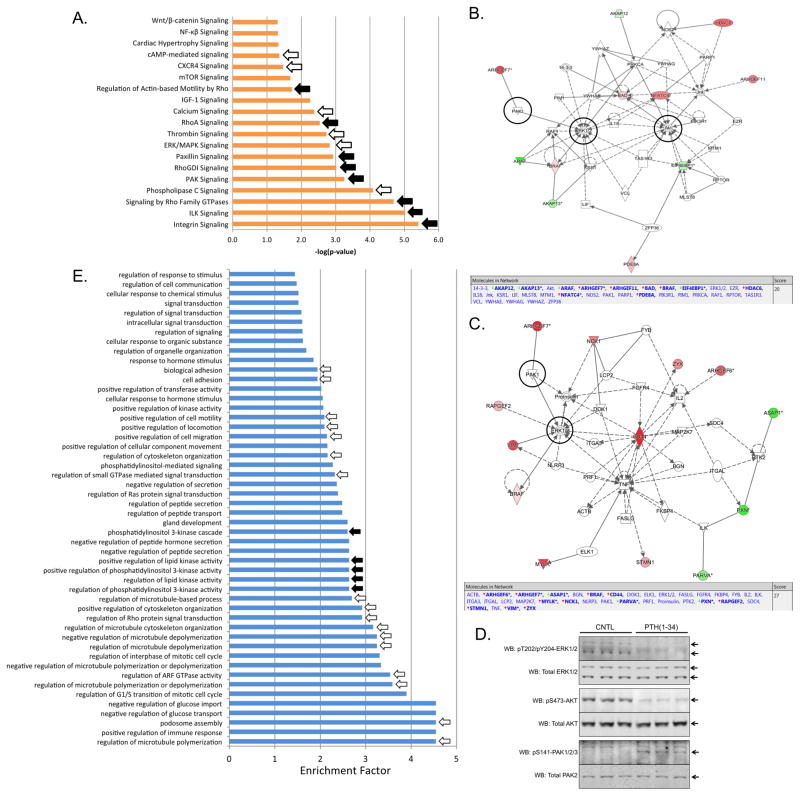
Figure 6.
Informatic analysis of PTH(1-34) regulated signaling pathways and biological processes. A) Ingenuity® Pathways Analysis (www.ingenuity.com/) performed using the list regulated phosphorylation sites detected in PTH(1-34)-stimulated MC3T3-E1 osteoblasts. Significantly regulated pathways were defined as; ≥2 genes per group, p<0.05 enrichment compared to a standard murine background database. Pathways related to canonical GPCR signaling (white arrows) and small GTPase regulation (black arrows) are indicated. B) The top-scoring IPA network diagram generated by combining the list of observed regulated phosphorylation events associated with classical GPCR signaling pathways. The network components, along with the identity and direction of regulation of observed factors (red arrows, increasing; green arrows, decreasing) are shown at the top of each panel. C) The top-scoring IPA network diagram generated by combining the list of observed regulated phosphorylation events associated with small GTPase signaling pathways. The network components, along with the identity and direction of regulation of observed factors are shown at the top of each panel. In panels B and C, black circles denote the position of AKT, ERK, and PAK within the predicted networks. D) Total cell protein isolated from differentiated MC3T3-E1 treated for 5 min with 0.1 μM PTH(1-34) or vehicle control (CNTL) was probed using antisera specific for activated (pT202/pY204) or total ERK1/2; active (pS473) or total AKT; and active (pS141) or total PAK2. Representative immunoblots of triplicate samples are shown. E) Significantly populated GObp terms determined in Perseus. The Top 50 enriched GObp terms are shown. GObp terms related to regulation of cytoskeletal dynamics (white arrows) and regulation of PI3K/AKT and lipid kinase signaling (black arrows) are indicated.

