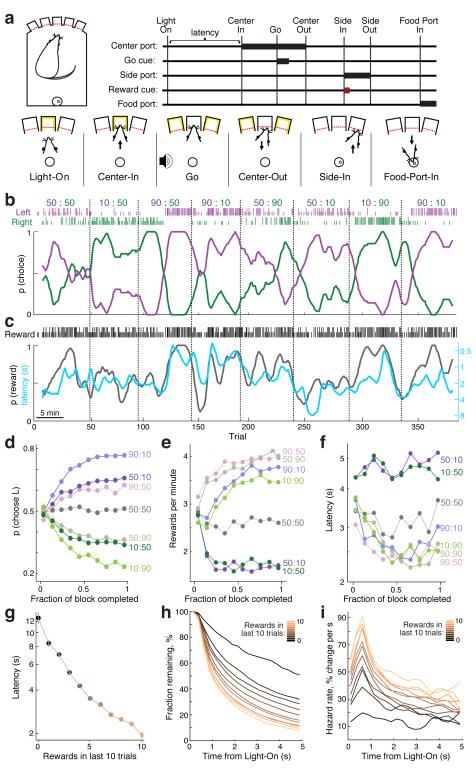
Figure 1. Adaptive choice and motivation in the trial-and-error task.
(a) Sequence of behavioral events (in rewarded trials). (b) Choice behavior in a representative session. Numbers at top denote nominal block-by-block reward probabilities for left (purple) and right (green) choices. Tick marks indicate actual choices and outcomes on each trial (tall ticks indicate rewarded trials, short ticks unrewarded). The same choice data is shown below in smoothed form (thick lines; 7-trial smoothing). (c) Relationship between reward rate and latency for the same session. Here tick marks are used to indicate only whether trials were rewarded or not, regardless of choice. Solid black line shows reward rate, and cyan line shows latency (on inverted log scale), both smoothed in the same way as B. (d) Choices progressively adapt towards the block reward probabilities (data set for panels d-i: n = 14 rats, 125 sessions, 2738 +/− 284 trials per rat). (e) Reward rate breakdown by block reward probabilities. (f) Latencies by block reward probabilities. Latencies become rapidly shorter when reward rate is higher. (g) Latencies by proportion of recent trials rewarded. Error bars represent s.e.m. (h) Latency distributions presented as survivor curves (i.e. the average fraction of trials for which the Center-In event has not yet happened, by time elapsed from Light-On) broken down by proportion of recent trials rewarded. (i) Same latency distributions as panel h, but presented as hazard rates (i.e. the instantaneous probability that the Center-In event will happen, if it has not happened yet). The initial bump in the first second after Light-On reflects engaged trials (see Supplementary Fig.1), after that hazard rates are relatively stable and continue to scale with reward history.

