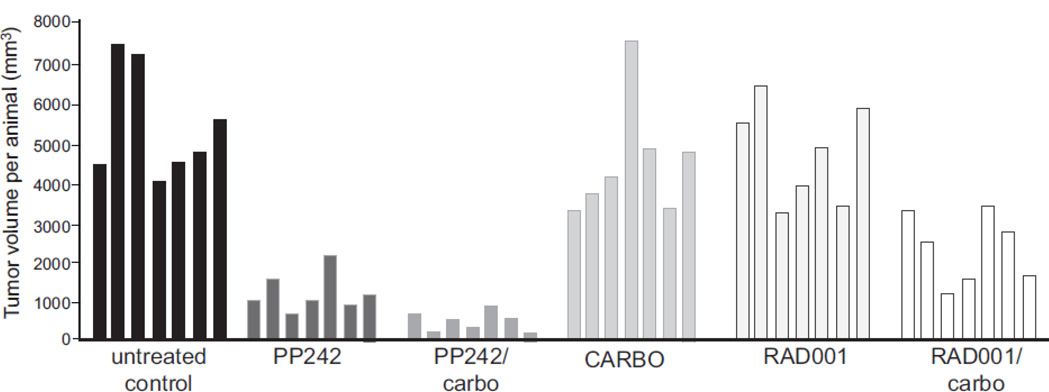
Fig. 3.
Waterfall plot of individual AN3CA tumor responses to treatment with PP242, RAD001 without or with concurrent carboplatin. The data shown in Figure 3 were replotted to demonstrate individual final treatment responses per animal at the end of the 25 day treatment cycle. Each column represents one individual mouse corresponding to the different treatment groups.

