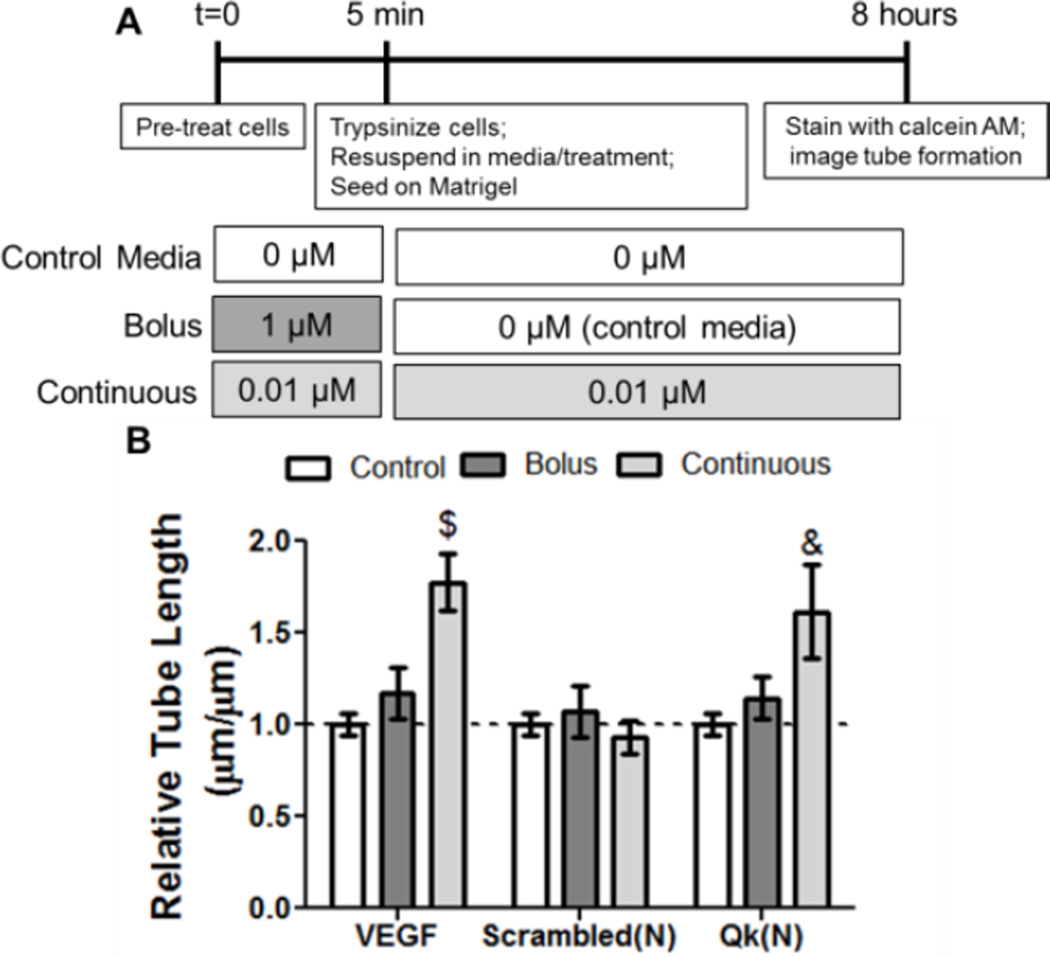
Figure 2.
In vitro analysis of the effect of bolus versus continuous delivery of Qk. A) Scheme of experimental setup, and B) results of tube formation data. A) To simulate bolus treatment, cells were pre-treated with a high dose for 5 minutes then given control media alone for the remainder of the 8 hour experiment. To simulate continuous delivery, cells received a low dose for the pre-treatment phase as well as the remainder of the 8 hours. Peptide doses were selected to have approximately the same dose-duration (0.01 µM × 8 hours ≈ 1.0 µM × 5 min). VEGF doses were 10 ng mL−1 (bolus) and 1 ng mL−1 (continuous). & p<0.01, $p<0.001 vs. control media. n=9, error bars represent SEM.

