
Fig. 4.
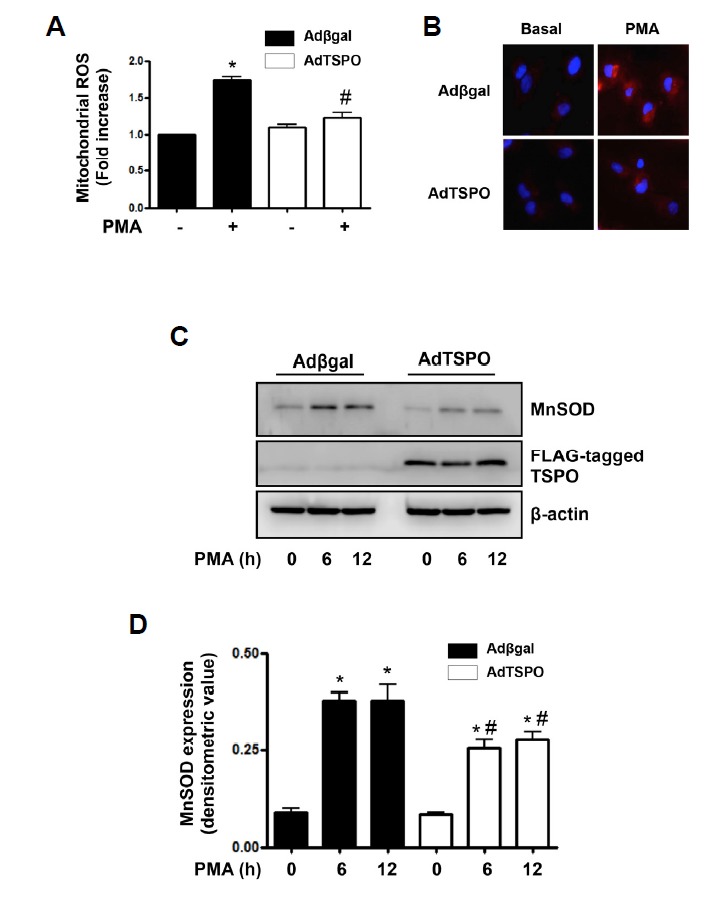
TSPO overexpression inhibited PMA-induced mitochondrial ROS generation and MnSOD expression in endothelial cells. (A) Overexpression of TSPO inhibited PMA-induced mitochondrial ROS generation. AdTSPO-infected cells were exposed to 250 nM PMA for 6 h. Relative mitochondrial ROS generation was determined from MitoSOX™ fluorescence assays. Fluorescence emission was measured at 590 nm after excitation at 530 nm. Values are expressed as mean fold-change in arbitrary fluorescence values over baseline values. Each bars show mean ± S.E.M., n = 5. *p < 0.05 vs. baseline value, #p < 0.05 vs. PMA alone. (B) Representative fluorescent images show PMA-induced mitochondrial ROS level in AdTSPO-infected cells. Cells were stained with Mitosox Red (red fluorescence) for mitochondrial ROS detection and 4′,6-diamidino-2-phenylindole (DAPI, blue fluorescence) for nucleus staining. (C) Overexpression of TSPO inhibited PMA-induced MnSOD expression. AdTSPO-infected cells were exposed to 250 nM PMA for 6 and 12 h. MnSOD expression was detected with the anti-MnSOD antibody in Western blots. TSPO-overexpression was confirmed by anti-FLAG antibody. The β-actin was used as a loading control. The displayed results are representative of three independent experiments. (D) Densitometric analysis for Fig. 4C. Each bar represents mean ± SEM (n = 3). *p < 0.05 vs. baseline value, #p < 0.05 vs. Adβgal.