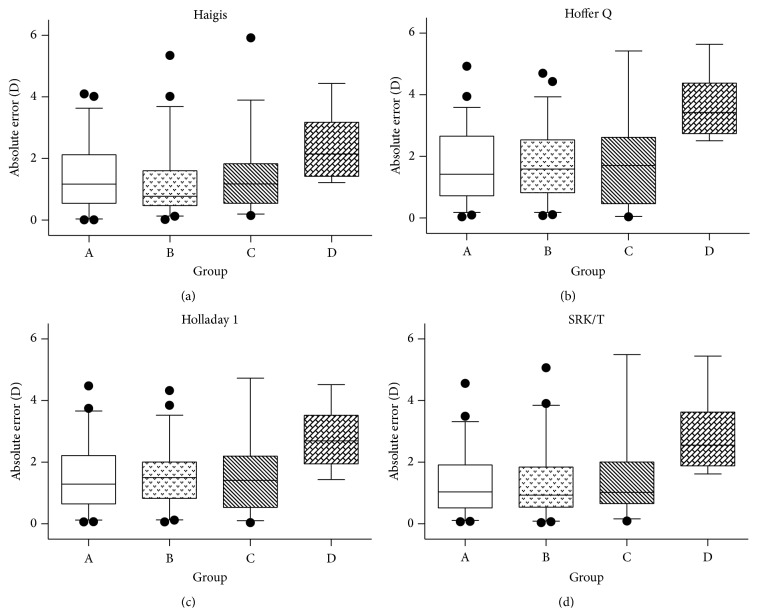
Figure 2.
Subgroup analysis: absolute errors for Groups A–D calculated using the four IOL formulas. All four formulas were least accurate for eyes within Group D. The overall median absolute error was significantly higher for Group D than for Groups A, B, and C (P = 0.002, 0.002 and 0.010, resp., as determined by a repeated-measures ANOVA test). The whiskers indicate 5 and 95 percentile of absolute errors in each group. D, diopters.

