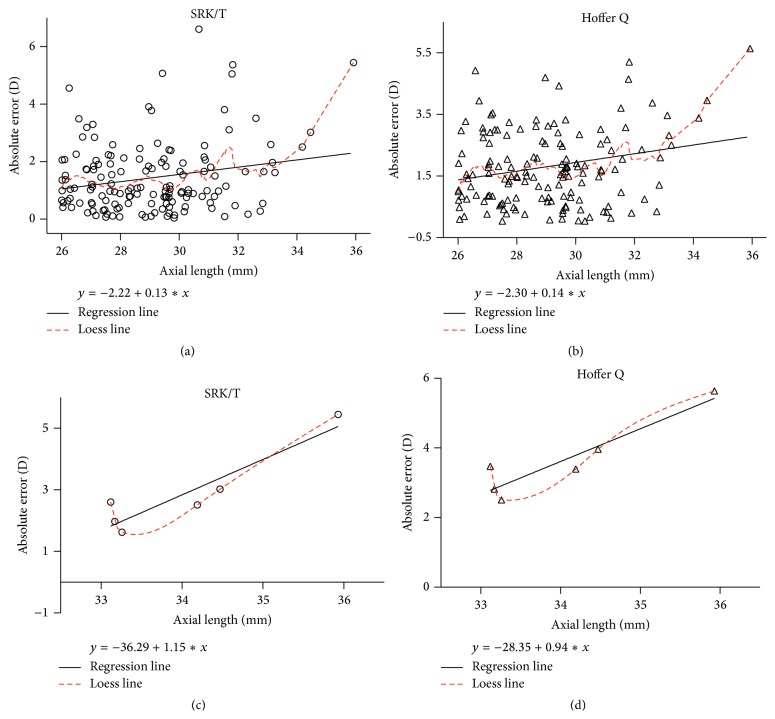
Figure 3.
Correlations between axial length and absolute error. The associations between axial length and absolute error were analyzed using absolute errors derived from (a) the SRK/T formula (r = 0.212; P = 0.010; regression equation: y = −2.22 + 0.13x) and (b) the Hoffer Q formula (r = 0.223; P = 0.007; regression equation: y = −2.30 + 0.14x). Similar analyses were carried out with Group D data only using (c) the SRK/T formula (r = 0.926; P = 0.008; regression equation: y = −36.29 + 1.15x) and (d) the Hoffer Q formula (r = 0.928; P = 0.008; regression equation: y = −28.35 + 0.94x).

