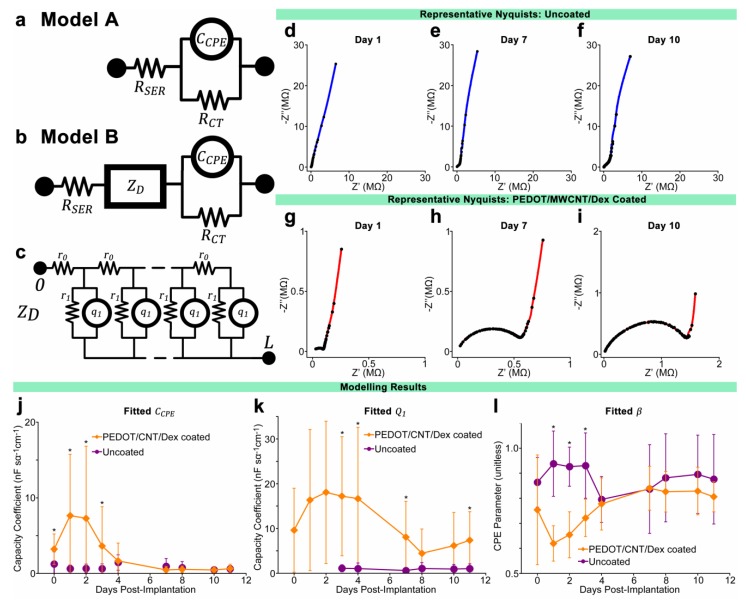
Figure 3.
(a,b) Equivalent circuit models for uncoated electrodes in PBS or initial days post-implantation (model A) and uncoated electrodes at later days post-implantation as well as PEDOT/MWCNT/Dex-coated electrodes (model B), with distributed element ZD representing the polymer coating as well as tissue encapsulation; (c) Schematic of the dual-channel distributed diffusion impedance element ZD; (d–i) Representative Nyquist impedance plots of uncoated (d–f) and coated (g–i) electrodes at three time points post-implantation, with all plots exhibiting an identical frequency range (100 Hz to 33 kHz). Note contrast between uncoated and coated Nyquist plots at days 7 and 10 despite statistically identical 1 kHz impedance. The growing semi-circular features at higher frequencies within (g–i) suggest the development of encapsulation over coated electrodes not present in uncoated electrodes; (j–l) Average fitted values of modeling parameters CCPE, Q1, and β. Q1 were not fitted for days 0–2 for uncoated probes due to use of model A. Comparatively large values of CCPE during the initial four days indicates a coating benefit to electrode capacitance that diminished at later points. Reducing values of Q1 indicate a reduction in coating/electrolyte capacitance, possibly due to changing surface area. β exhibited low values during first four days, but later increased to values equivalent to uncoated electrodes, suggesting a change to the nature of the coating/electrode interface. N varied from session to session. All data presented as mean ± SD. * p < 0.01.

