Figure 4.
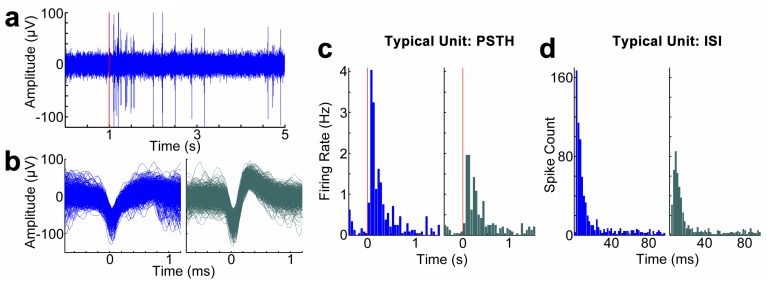
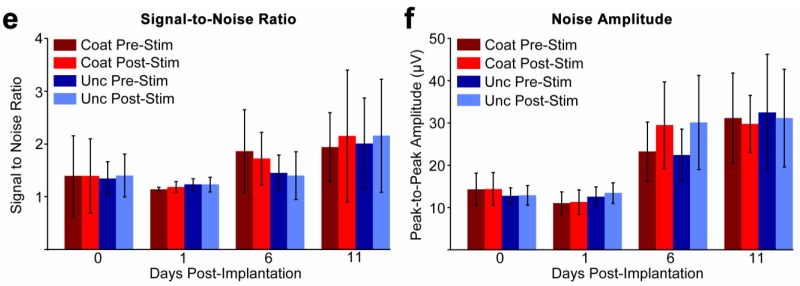
(a–d) Representative unit recording from a PEDOT/MWCNT/Dex-coated electrode at day 11 post-implantation. Red line indicates onset of visual stimulus. (a) Filtered (300 Hz–3 kHz) data stream; (b) Two example units sorted from the same coated electrode; (c) Peristimulus time histogram (PSTH) for each respective unit.; (d) Interspike interval (ISI) histogram of the two example units; (e) Average signal-to-noise ratio (SNR) values on representative days pre and post-release stimulus; (f) Average noise amplitude on representative days pre and post-release stimulus. All groups exhibited similar values within each day, suggesting equivalent performance. All data presented as mean ± SD. p > 0.01 for all.


