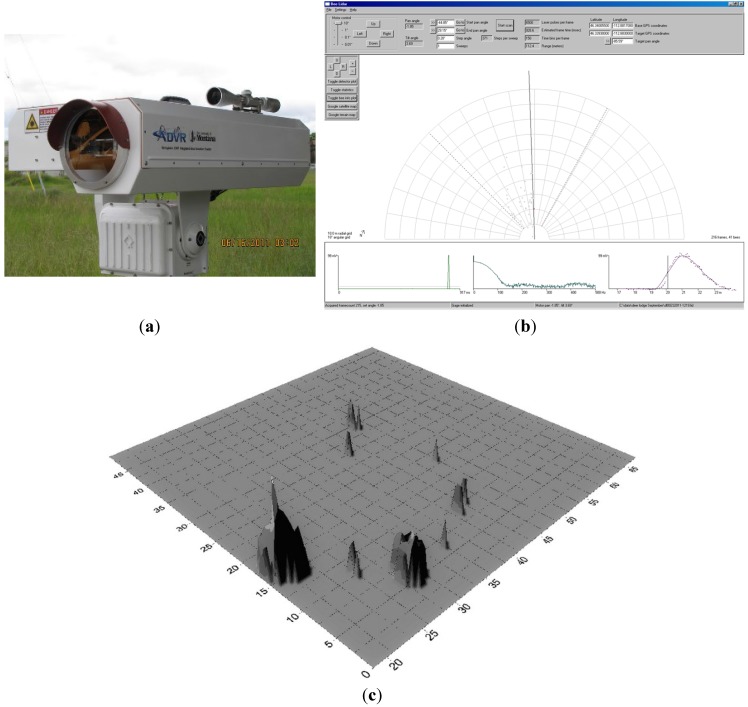
Figure 6.
(a) Commercial prototype of bee-mapping LIDAR; (b) Instrument display screen. The computer screen display provides real-time detection of individual bees (i.e., dots shown in the sweep). Charts at the bottom characterize signal duration, shape, and frequency for each detected insect. Banner at the top gives instrument settings and controls. Most recent bee detection appears on screen in red; (c) Three-dimensional density map of actual bee locations across a field from one of our trials using bees conditioned to find a unique scent. The larger and taller the vertical “cone”, the more bees at that spot, and concurrently, the higher the vapor concentration of the subject chemical.

