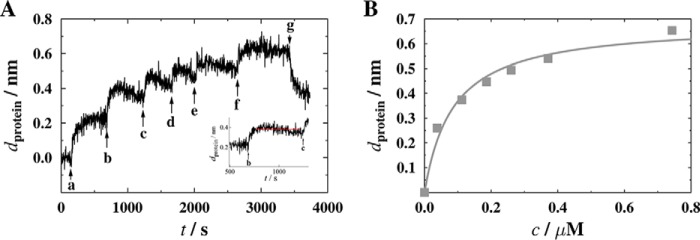
FIGURE 5.
Adsorption of CB2PH to PI(3)P. A, characteristic time trace of a RIfS experiment showing the specific binding of CB2PH to a PI(3)P-containing membrane. Different concentrations of CB2PH were added at time points as indicated by arrows (a, 0.038 μm; b, 0.11 μm; c, 0.19 μm; d, 0.26 μm; e, 0.37 μm; f, 0.74 μm). After rinsing the system with buffer A (g), a fraction of the bound protein desorbs from the membrane, indicating reversible binding. The inset shows the determination of the saturation value dprotein. B, adsorption isotherm obtained from the data shown in A. The solid gray line is the result of fitting a Langmuir isotherm (Equation 1) to the data with dprotein-max = 0.69 ± 0.04 nm and KD = 0.09 ± 0.02 μm.

