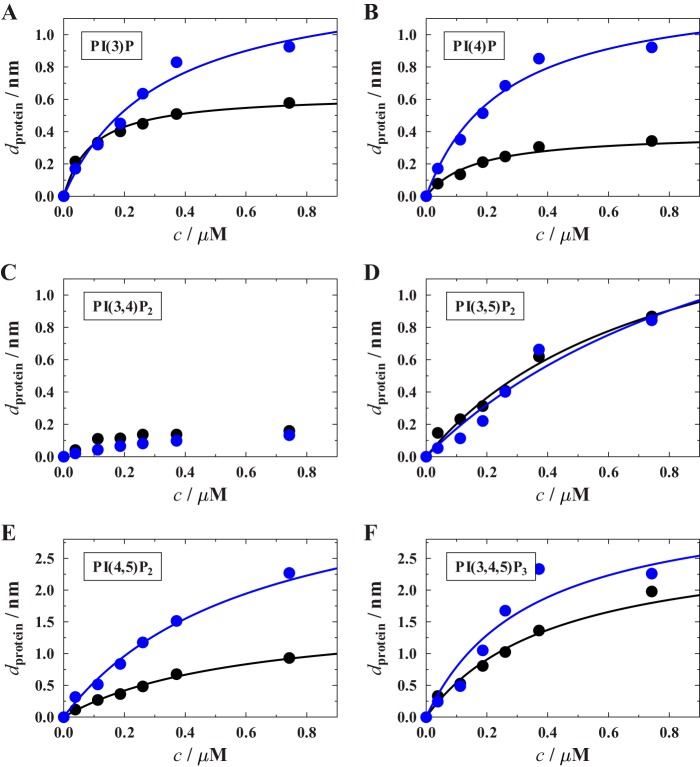
FIGURE 6.
Binding isotherms of CB2PH (black circles) and CB2SH3− (blue circles) obtained for different lipid compositions. A, POPC/PI(3)P (9:1); B, POPC/PI(4)P (9:1); C, POPC/PI(3,4)P2 (9:1); D, POPC/PI(3,5)P2 (9:1); E, POPC/PI(4,5)P2 (9:1); F, POPC/PI(3,4,5)P3. For each isotherm, at least three independent RIfS experiments were performed, and the data represent the mean values. The solid lines are results of fitting Equation 1 to the data. The obtained KD values are summarized in Table 2.

