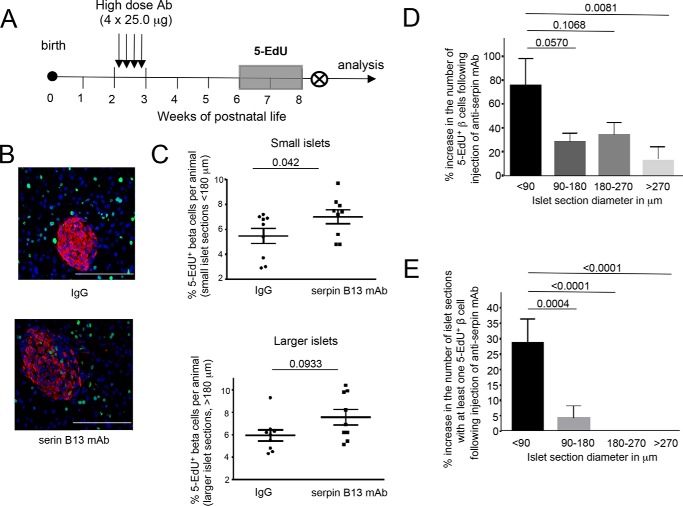
FIGURE 4.
Increased beta cell 5-EdU incorporation in serpin B13 mAb-treated mice. A, strategy for Ab injection and 5-EdU incorporation. B, representative staining of pancreatic islets for Edu. Red, insulin; green, EdU; blue, DAPI. C, the percentages of 5-EdU beta cells in islet sections per animal in small and larger islets. D, percent increase in the number of 5-EdU+ beta cells and E, pancreatic islet sections with at least one 5-EdU+ beta cell following serpin B13 mAb injection. Data are presented as mean ± S.E.

