
FIGURE 9.
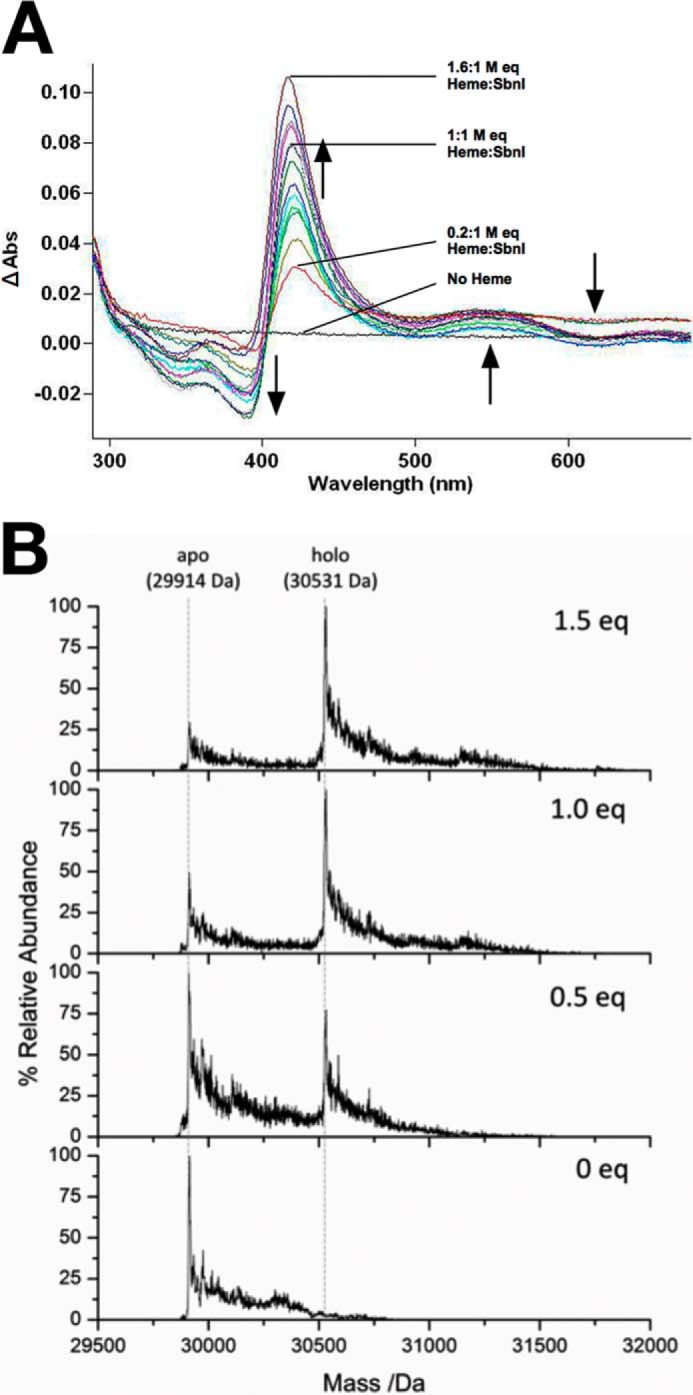
SbnI binds heme. A, UV-visible difference absorbance spectra recorded following addition of increasing concentrations of heme to 1 μm SbnI in 300 mm ammonium formate, pH 7.4. The absorption spectra were measured at 22 °C. The shift in spectral maxima coincident with the absorption spectrum of the protein-bound heme with increasing heme concentrations is indicated by arrows. The concentration of the heme at the end of the titration was 1.6 μm, where the increase in Soret peak is due to nonspecific heme stacking, as SbnI optimally binds heme at a 1:1 molar ratio heme/SbnI, as indicated by ESI-MS data shown in B. B, deconvoluted electrospray ionization mass spectral data of SbnI in 300 mm ammonium formate, pH 7.4, and 2 mm DTT as a function of increasing heme stoichiometry (0 mol eq (bottom) to 1.5 mol eq added heme (top)). The heme solution was freshly prepared prior to the measurement. The apo-SbnI has a mass of 29,914 Da. Heme binding to the holo-SbnI results in a new mass at 30,531 Da. The relative abundance of the apo-SbnI decreases as the heme concentration increases. The holo-SbnI with a single heme bound (mass 30,531 Da) is the major species even with excess heme (top).