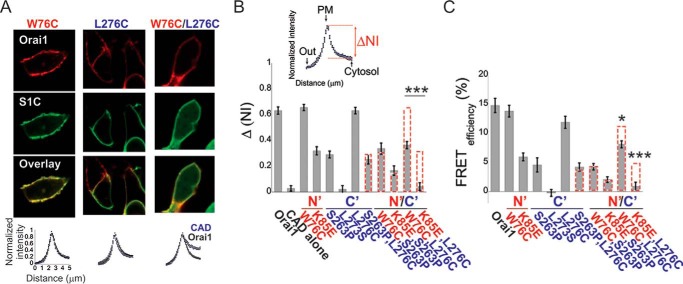
FIGURE 5.
Cooperative binding of S1C to the N and C termini of Orai1. A and B, representative fluorescence images (top panel) and summary of normalized intensity values (bottom panel) across the plasma membrane and intracellular regions of cells expressing EGFP-S1C together with the indicated mCherry-Orai1 mutants (n = 12–22 cells). B, quantitative summary of EGFP-S1C fraction (ΔNI = NIPM − NICyto, see inset) that is localized to the plasma membrane (PM). C, summary of FRET efficiency values measured in cells expressing EGFP-S1C together with mCherry-Orai1 or with the indicated single or double mCherry-Orai1 mutants (n = 15–35 cells). Dashed red columns show the predicted additive effect for the double mutants. *, p < 0.05; ***, p < 0.001.

