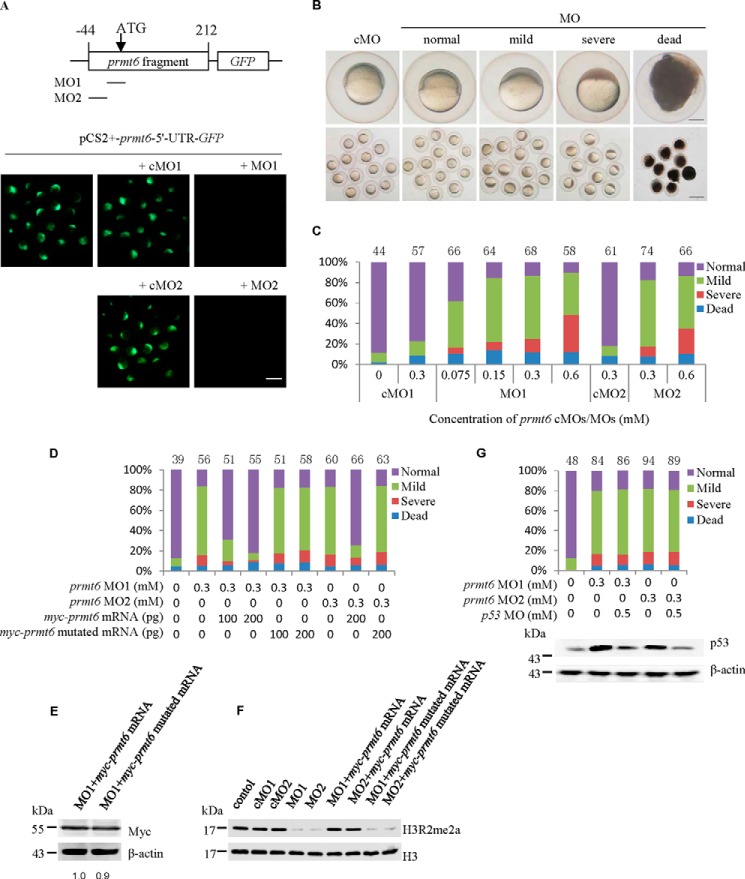
FIGURE 2.
Prmt6 is essential for early zebrafish development. A, successful suppression of prmt6 expression was confirmed in embryos injected with the plasmid pCS2+-prmt6-5′-UTR-GFP and prmt6 MO1/MO2. B, knockdown of Pmrt6 expression using the prmt6 MOs resulted in a normal, mild, or severe phenotype characterized by defective epiboly as shown at 6 hpf. The single enlarged embryo is shown from lateral views with the animal pole on the top. C, a quantification of the relative distribution of the phenotype of prmt6 morphants at 6 hpf. D, a quantification of the relative distribution of the phenotype of prmt6 morphants rescued with myc-prmt6 mRNA (containing only the coding sequence) and mutated myc-prmt6 mRNA (containing only the coding sequence) that codes an inactive form of Prmt6 (VLD to KLA). E, a representative Western blot showing the protein expression level of the rescue constructs by Myc tag. -Fold of basal, the Myc ratios were determined by the densitometric value of each construct relative to that of the control (myc-prmt6 mRNA) after normalizing to the β-actin densitometric values. myc-prmt6 mRNA/myc-prmt6 mutated mRNA, 200/200 pg. F, a representative Western blot showing the effect of the prmt6 MOs on the H3R2me2a level. cMOs/MOs, 0.3/0.3 mm; myc-prmt6 mRNA/myc-prmt6 mutated mRNA, 200/200 pg. G, a quantification of the relative distribution of the phenotype of prmt6 morphants and a representative Western blot showing the p53 protein level rescued with p53 MO. Protein loads per lane for E, F, and G, 37.5 μg. In C, D, and G, the number of embryos in each group is indicated above the relevant column. Scale bar in A and B, 200 μm.

