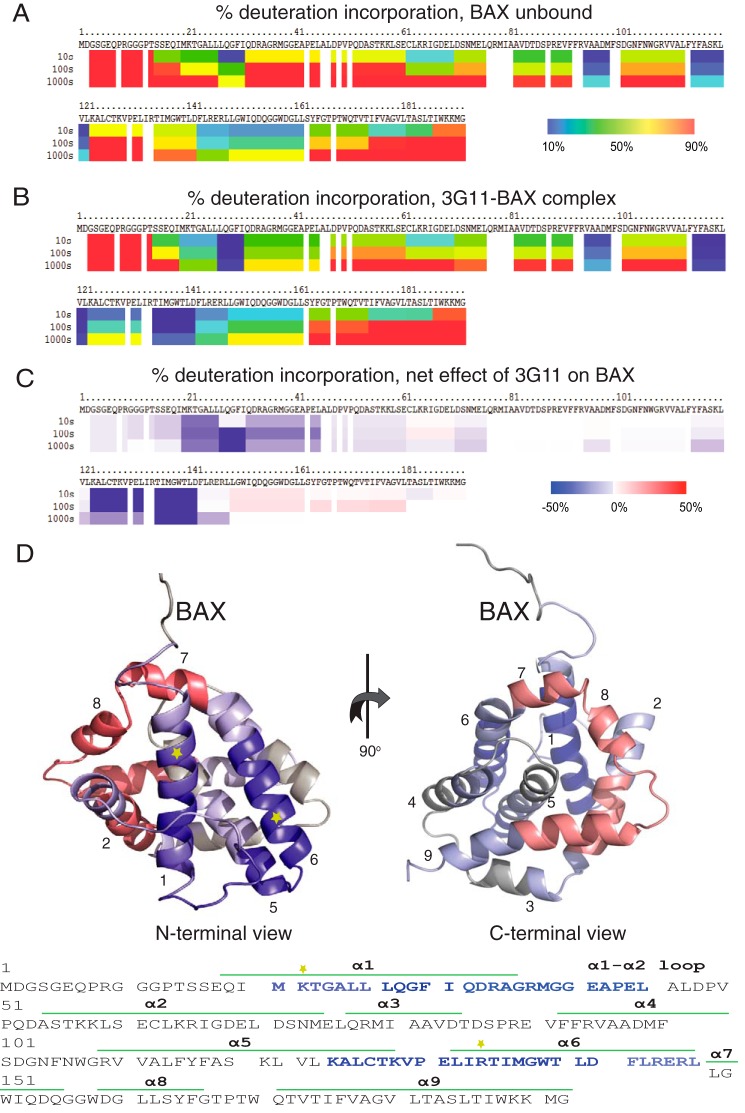
FIGURE 5.
3G11 binds to the N-terminal surface of BAX. A, percent deuterium incorporation of unbound BAX conformation in solution over 10, 100, and 1000 s. HXMS analysis suggests increased rates of deuterium exchange in the N-terminal region of BAX, the α1-α2 loop, helix α2, and part of helices α5, α8, and α9. B, percent deuterium incorporation of 3G11-bound BAX in solution over 10, 100, and 1000 s. C, the relative difference of percent deuterium incorporation of BAX conformation bound to 3G11 minus the percent deuterium incorporation of BAX conformation alone over 10, 100, and 1000 s. HXMS analysis suggests increased protection from deuterium incorporation in residues of helices α1 and α6, part of helix α5, and the α1-α2 loop compared with the unbound BAX. C, the regions of significant protection from deuterium incorporation (>−20%) are highlighted in blue on the ribbon representation of the full-length BAX structure (PDB code 16F6) and on the amino acid sequence of BAX. The ribbon representation of BAX also highlights regions with moderate protection (−20–0%) in light blue, regions with no change in deuterium incorporation in gray, and regions with moderately increased deuterium incorporation (0–20%) in light red. The positions of the Lys-21 residue in helix 1 and the Arg-134 residue in helix 6 are shown with yellow stars on the ribbon structure and the amino acid sequence of BAX.

