FIGURE 6.
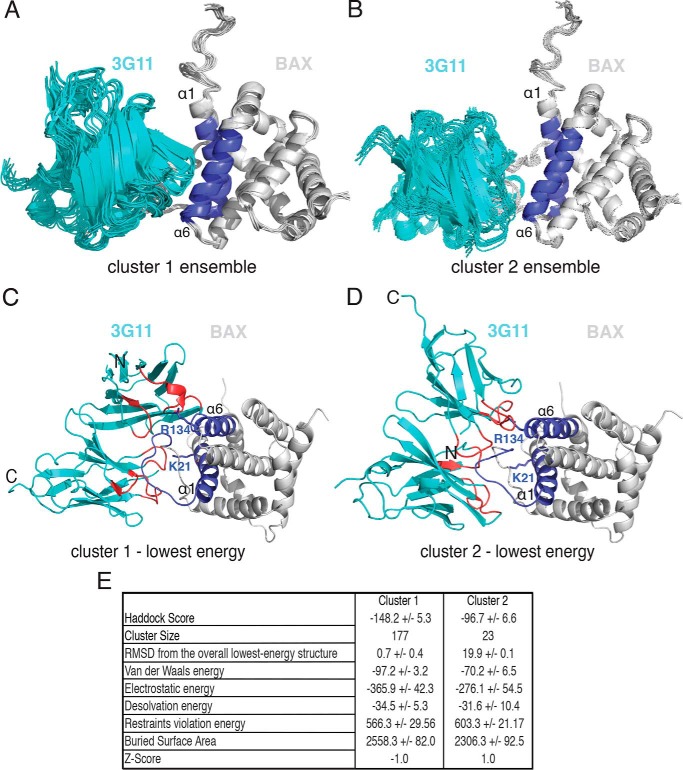
3G11 binding to BAX blocks the N-terminal activation site. A and B, structural ensemble of the 3G11-BAX complex, as calculated with HADDOCK, showing the 10 lowest-energy structures of cluster 1 and cluster 2. Structures from both clusters are centered on the interface of 3G11 (cyan) and BAX (light gray) and overlaid using the BAX structure from the lowest-energy complex structure. The N-terminal interaction surface of BAX with α1 and α6 is shown in blue. C and D, ribbon representations of the 3G11-BAX lowest-energy structures for each cluster highlighting the binding of 3G11 (cyan) using residues in the CDRs (red) to the N-terminal interaction surface (blue) of BAX (light gray). The Lys-21 and Arg-134 residues of BAX are shown as blue sticks and predicted to interact with 3G11 CDR residues. The N-terminal and C-terminal residues of 3G11 are shown by N and C, respectively. E, statistics of HADDOCK calculations for clusters 1 and 2.

