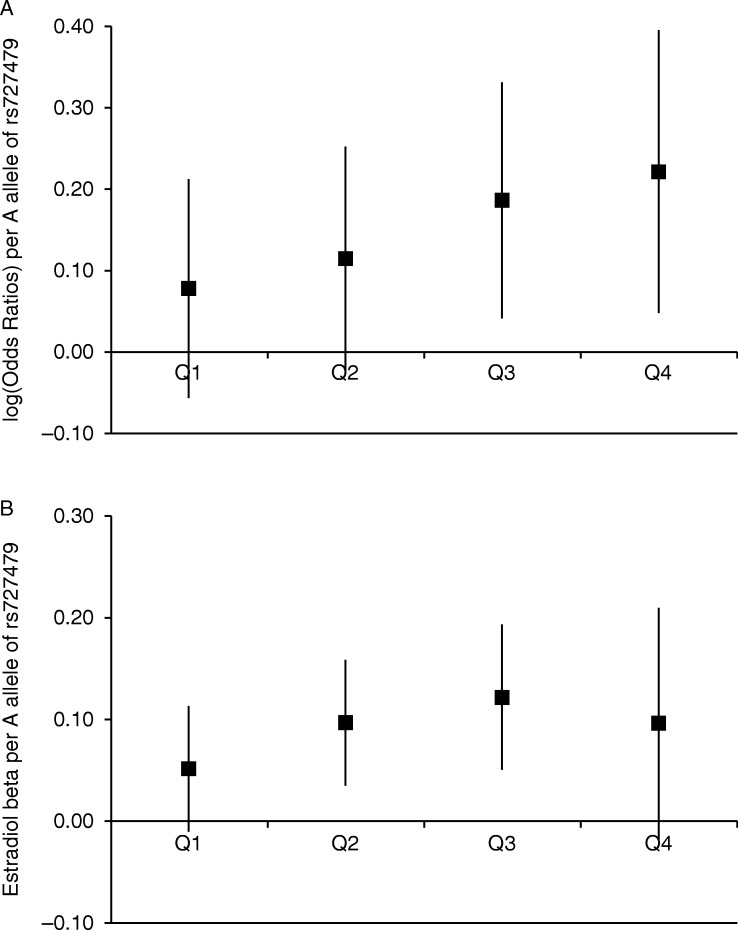
Figure 3.
Association of SNP rs727479 with (A) endometrial cancer and (B) E2 levels, by quartile of BMI distribution. In Fig. 3A the log(OR) of endometrial cancer associated with each A allele of SNP rs727479 is shown for each quartile of the BMI distribution, adjusting for age. There is a borderline significant interaction between genotype and BMI quartile (P=0.047). Figure 3B shows the regression coefficient (β) for the association between each A allele of rs727479 and log-transformed E2 levels (adjusted for laboratory batch, study, age at blood draw, BMI, HRT use and menopausal status), (Pinteraction=0.066). For both plots, the error bars are 95% CI, and the quartiles are based on the BMI distribution in endometrial cancer cases, to allow for comparability between plots, and to ensure sufficient cases in each quartile.

 This work is licensed under a