Graph 1.

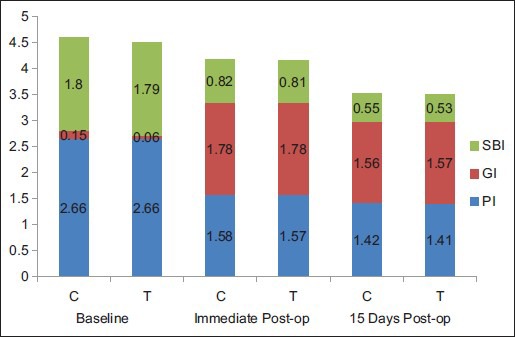
Comparison of mean of PI, GI, and SBI between test (T) and control (C) groups at baseline, immediate post-op, and 15 days post-op

Comparison of mean of PI, GI, and SBI between test (T) and control (C) groups at baseline, immediate post-op, and 15 days post-op