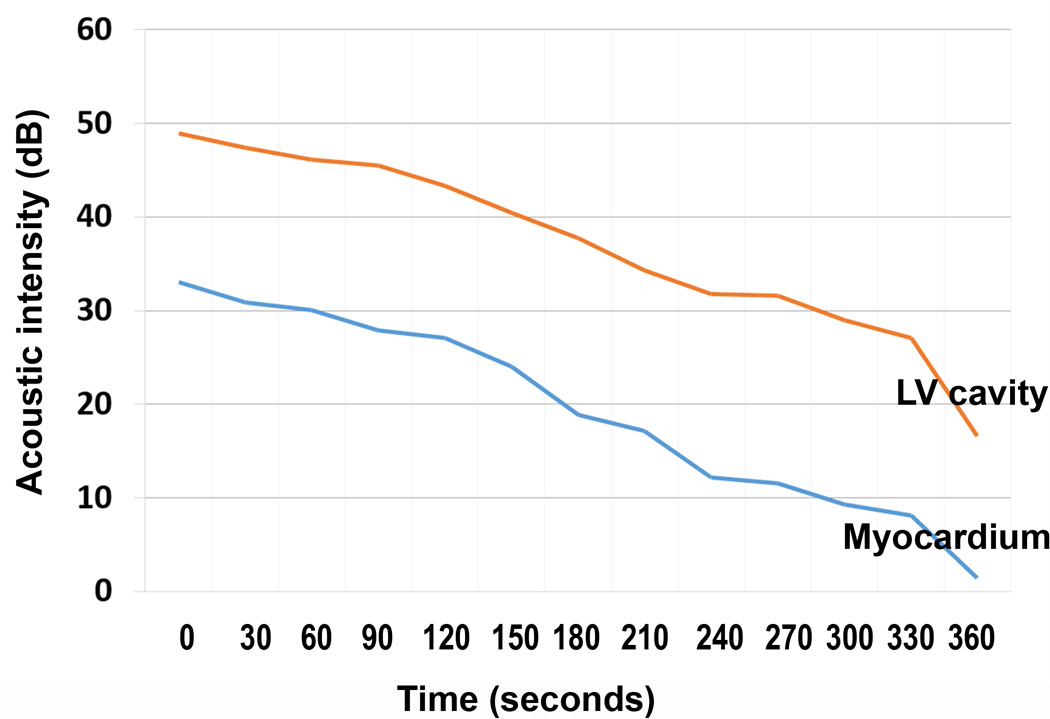
Figure 5.
Demonstration of the washout of the myocardial and left ventricular cavity contrast after the C3 has been injected using a 1:1 triggering imaging technique. Using Q Lab software, this intensity was plotted on the accompanying graph to demonstrate the corresponding disappearance of contrast as a function of time, verifying that the contrast in the myocardium is not coming from trapped microbubbles within the microcirculation.

