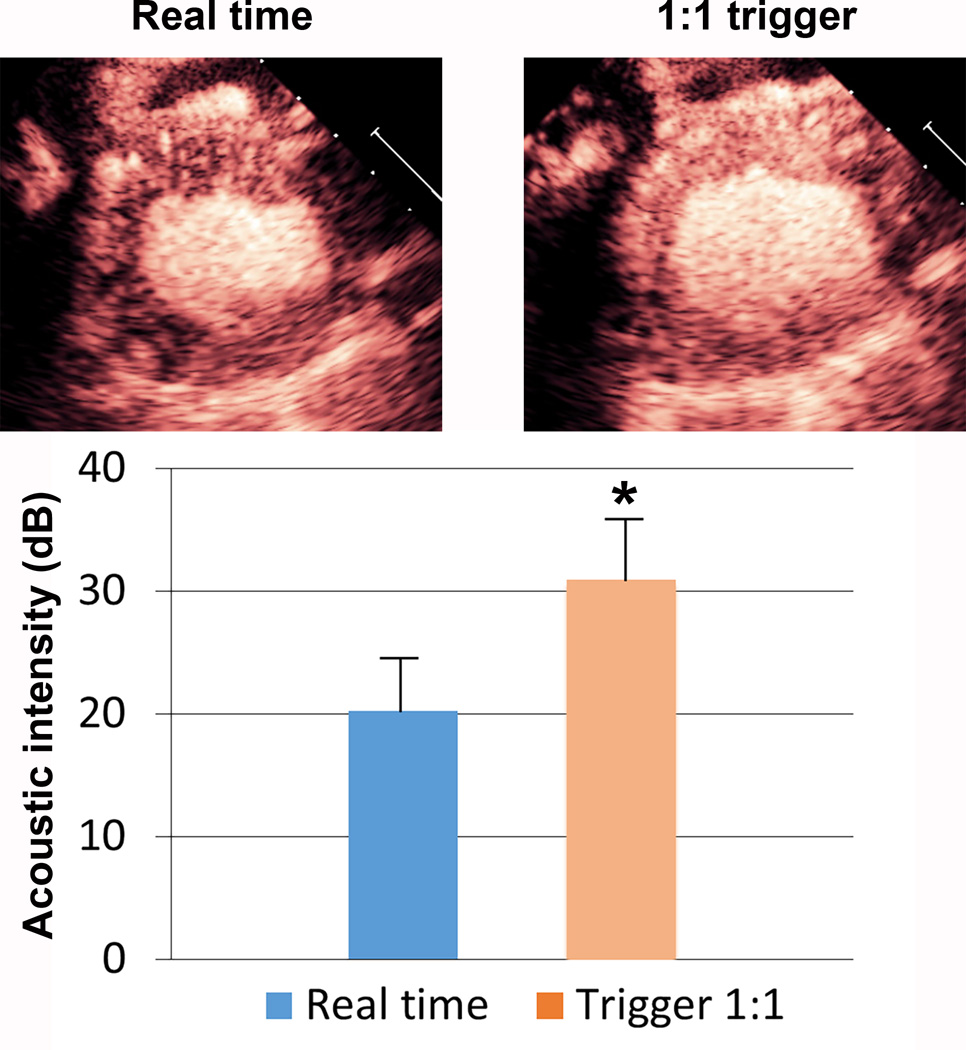
Figure 6.
A representative image and graphical display of the myocardial contrast enhancement achieved at 1:1 triggering at end systole versus real time imaging at the same high mechanical index (1.2). The comparisons (n=19) were done in three separate pigs. There was a slight, but highly significant (p<0.0001), increase in signal intensity while in the triggering mode. This would indicate that some simultaneous generation and destruction of microbubbles is occurring in the microcirculation while in the real time high MI. *p<0.0001 compared to real time imaging.

