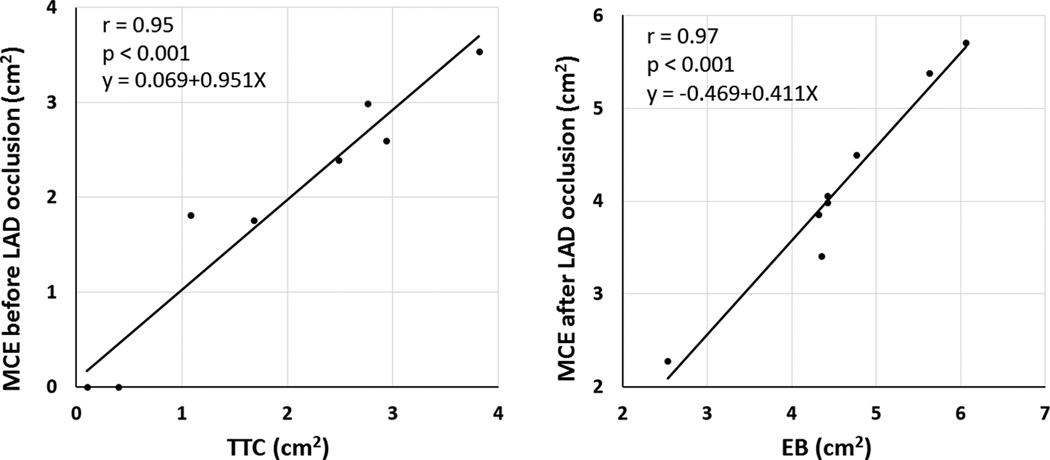
Figure 7.
Correlations between TTC derived infarct area (left panel) and averaged defect size from 1.3 MHz/2.6 MHz transthoracic triggered imaging and 1.7/3.4 MHz real time harmonic imaging (r=0.95; p<0.001). During repeat left anterior descending occlusion, the Evans Blue (EB) unstained area correlated closely with perfusion defect size using either the triggered 1:1 high MI setting or real time high MI setting. Data points are the same as pig number, and the correlations represent the average of measurements from the 1.3 MHz triggered data and 1.7 MHz real time data for each pig.

