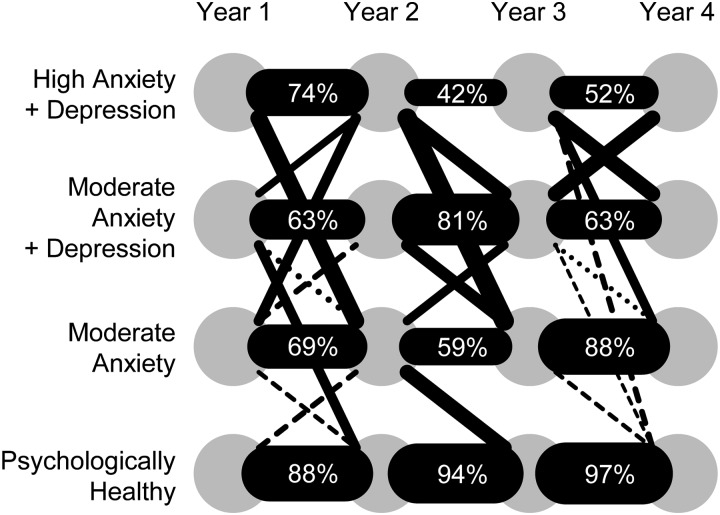
Fig. 4.
Estimated frequencies of class transitions. The thickness of each black connecting bar (or dashed line) is proportional to the estimated transition frequency. Numerical frequencies are shown where >40%. Dashed lines indicate frequencies of 5–10%. For clarity, class transition frequencies of <5% are not shown (see Supplementary Table S3 for full numerical data).

