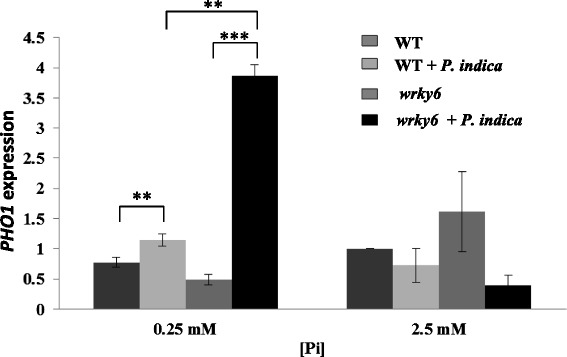
Fig. 6.

PHO1 expression after 3 days of co-cultivation or mock-treatment of the two symbionts under the two different Pi concentrations. Data are based on 3 independent experiments with 15 plants each. Bars represent SEs. Asterisks indicate significant differences, as determined by Student’s paired t-test for two tailed distribution (** P ≤ 0.01; *** P ≤ 0.001)
