Fig. 6.

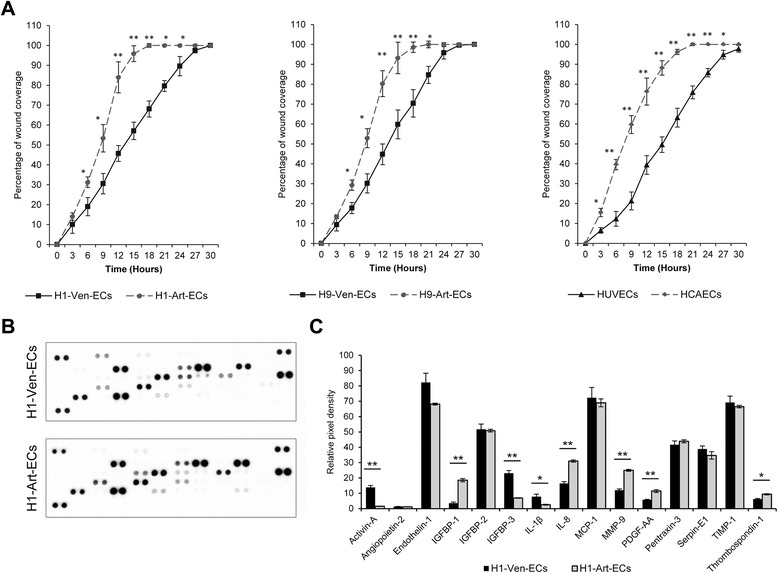
Assessment of cell migration and survey of angiocrine secretome profiles of hESC-derived arterial and venous ECs. a Graphical representation of kinetics of wound coverage among H1-Ven-ECs and H1-Art-ECs (left panel), H9-Ven-ECs and H9-Art-ECs (middle panel), HUVECs, and HCAECs (right panel). Error bars show standard deviation; n = 3. *p < 0.05, **p < 0.01. b Representative scans of angiogenesis antibody arrays demonstrating the secretion of various angiocrine factors by H1-Ven-ECs and H1-Art-ECs. Array images are obtained from 10-minute exposure of X-ray film. (Refer to Additional file 1 for co-ordinates of the antibody array). c Graphical representation of the relative amounts of selected angiocrine factors that show significant differences among the H1-hESC derived arterial and venous ECs. The bars represent relative amounts of factors secreted based on densitometric analysis of relative pixel density of the blots. Error bars show the standard deviation of two independent experiments. *p < 0.05, **p < 0.01. Art-EC Arterial endothelial cells, HCAEC Human coronary artery endothelial cells, hESC Human embryonic stem cells, HUVEC Human umbilical vein endothelial cells, IGF Insulin-like growth factor, IL Interleukin, MCP monocyte chemoattractant protein, MMP Matrix metalloproteinase, PDGF Platelet-derived growth factor, TIMP Tissue inhibitor of matrix metalloproteinase, Ven-EC Venous endothelial cells
