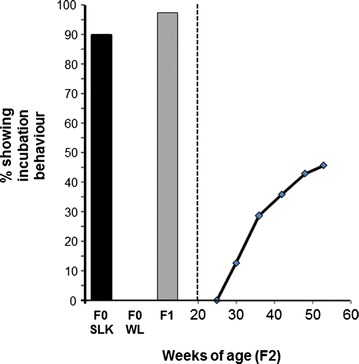
Fig. 1.

Percentage of hens that show complete incubation behaviour (incubation status trait class 1) in the founder SLK and WL breeds (F0) and in the F1 SLK × WL cross represented as a bar graph on the left hand of the graphic. On the right hand side of the graphic the cumulative incidence of incubation behaviour over the period of testing in the F2 population is represented as a line graph with the x-axis indicating weeks of age. At week 50 this is equivalent to the trait ‘incubation status’ class 1. For all data the y-axis represents the percentage of hens showing incubation behaviour (incubation status trait class 1)
