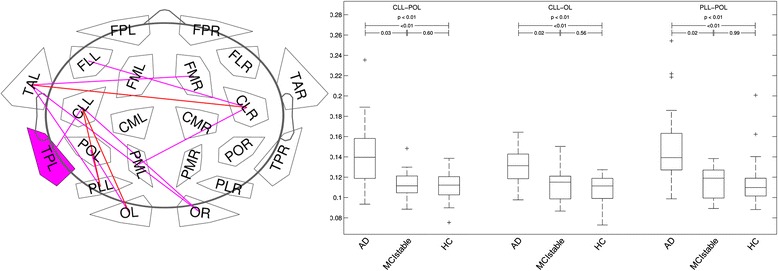
Fig. 4.

Links (microstate segmented phase lag index [msPLI]) in theta band with significant differences between groups. Plot: p < 0.05 (violet); p < 0.01 (red) (corrected for multiple comparisons). Box plot: axes indicate raw msPLI values. FP frontal parieto-occipital left, FM frontal midline, FL frontal lateral, CM central midline, CL central lateral, TA temporal anterior, TP temporal posterior, PL parietal lateral, PM parietal midline, PO parieto-occipital, O occipital, L left, R right, CLL_POL link centrolateral to parieto-occipital left, CLL-OL link centrolateral to occipital left, PLL-POL link parietolateral to parieto-occipital left, AD Alzheimer’s disease, MCIstable patients with stable or improving cognition within 30 months, HC healthy control subjects
