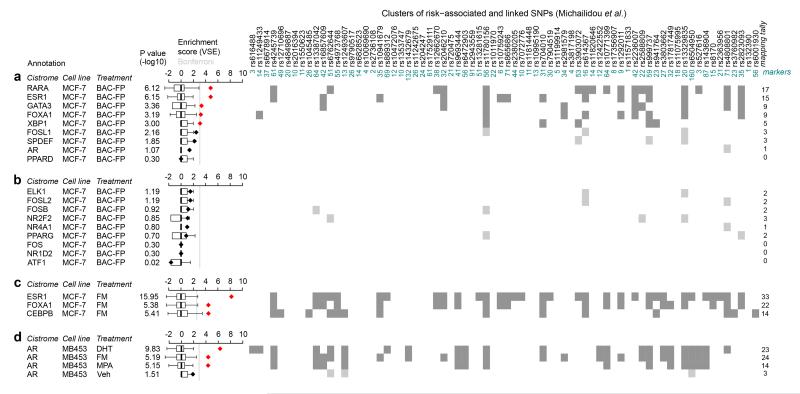
Figure 2. Enrichment of risk-TF binding sites at breast cancer GWAS loci.
VSE analysis7 of the cistrome of (a) 9 risk-TFs and (b) 9 non-risk TFs defined in the EVSE analysis for which ChIP-seq data was available13 in MCF-7 cells. Cells were transfected with BAC-fusion proteins (BAC-FP) of the relevant TF and eGFP and grown in full medium. Antibodies against eGFP were used in these ChIP experiments. VSE tallies that yielded a significant enrichment score are shown in dark grey, those that did not in light grey. (c) VSE analysis of ChIP-seq experiments using α-ESR1, α-FOXA1 and α-CEBPB antisera in MCF-7 cells. Cells were grown in full medium (FM). (d) VSE analysis of ChIP-seq data for AR using the molecular apocrine cell line MDAMB453 stimulated as indicated with DHT: 5αdihydro-testosterone; MPA: medroxyprogesterone acetate or vehicle treated or grown in full medium. Box plots show the normalized null distributions (box: 1st–3rd quartiles; bars: extremes). Diamonds show the corresponding VSE scores, either in black or in red for mapping tallies that satisfy a Bonferroni-corrected threshold for significance (P<0.01). P-values are based on null distributions from 1,000 random AVSs.

