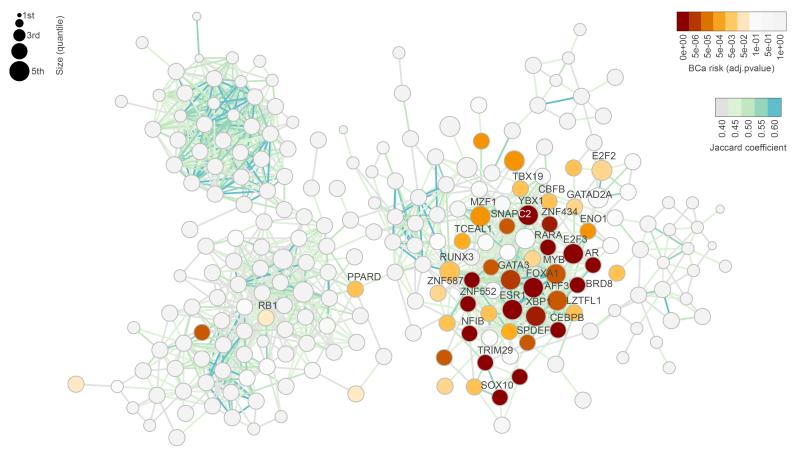
Figure 3. Regulatory network for breast cancer, showing clustering of breast cancer risk.
The network is depicted on the basis of the overlap of regulons, with risk association shown in yellow to red (based on cohort I of METABRIC). The 36 consensus risk-TFs identified in both cohorts are labelled. The colouring of the edges (shown in light green to blue) indicates the overlap as measured by the Jaccard coefficient (JC) and the size of circles represents the size of each regulon. Only regulons with JC ≥ 0.4 are shown in the diagram. All regulons and a heatmap depicting the overlap of the regulons of risk-TFs is shown in Supplementary Figure 13. BCa risk: Bonferroni adjusted p-values obtained for each regulon when calculating the enrichment with breast cancer GWAS loci in the EVSE analysis, using cohort I for calculating the network and eQTLs. P-values are based on null distributions from 1,000 random AVSs.

