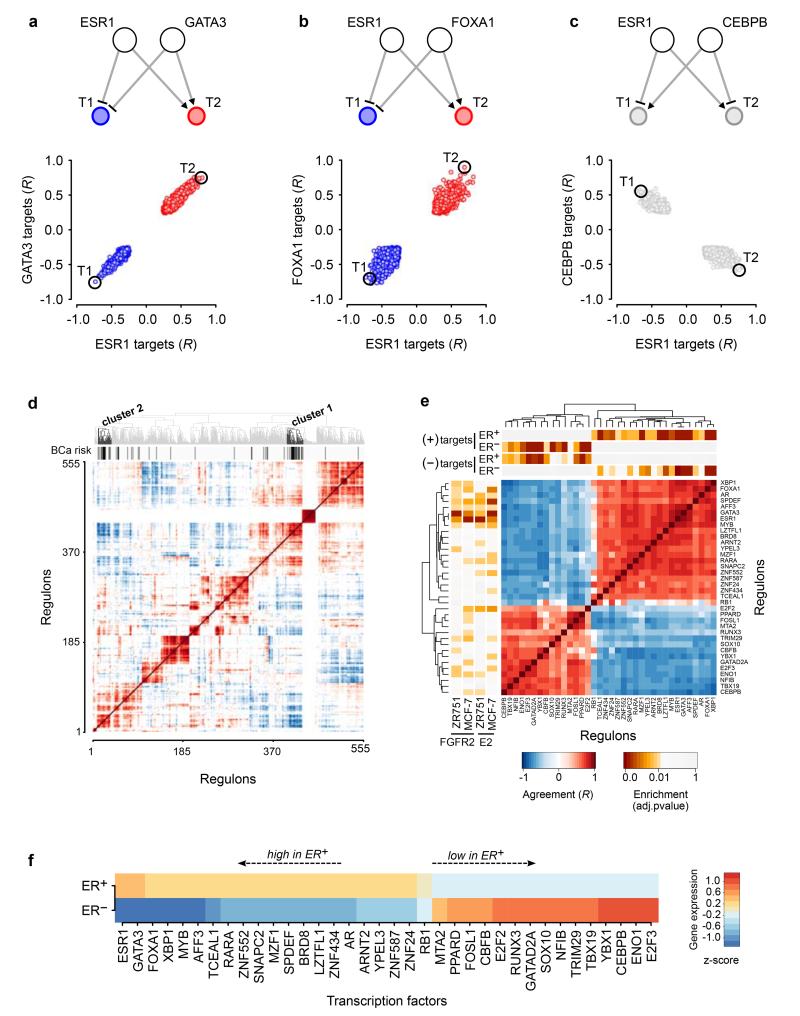
Figure 4. Correlation of expression of targets shared between TF pairs in breast tumours.
(a-c) Correlations of gene expression between a given TF and its targets were plotted for three different TF-TF pairs as indicated. Above each panel a cartoon depicts the observed interactions. Red circles indicate co-activation, blue circles co-repression. Targets are shown in grey if the two TFs have opposing effects on the target. (d) Heat map of the correlation of gene expression for targets shared by any pair of the 555 TFs (cohort I, METABRIC) whose regulons were of sufficient size to be analysed in the EVSE pipeline. Unsupervised clustering was applied to this correlation heat map resulting in the dendrogram shown at the top of the plot. The black bars depict the 36 risk-TFs, which fall into two distinct clusters. (e) Enlargement of the correlation heat map for the risk-TFs only. Above the matrix a bar with yellow to red colouring depicts the results (BH adjusted p-values) of a MRA analysis for the enrichment within each regulon of positive and negative targets that are upregulated in ER+ or ER− tumours, respectively, in cohort I of the METABRIC samples. The panel to the left of the matrix shows the master regulators identified for the FGFR2 and E2 responses. (f) Relative gene expression levels of the risk-TFs in ER+ or ER− tumours in cohort I of the METABRIC samples: expression levels were averaged in all ER+ and all ER− tumours and compared to expression levels averaged across all samples. TFs are shown ranked by differential gene expression between ER+ and ER− tumours.

