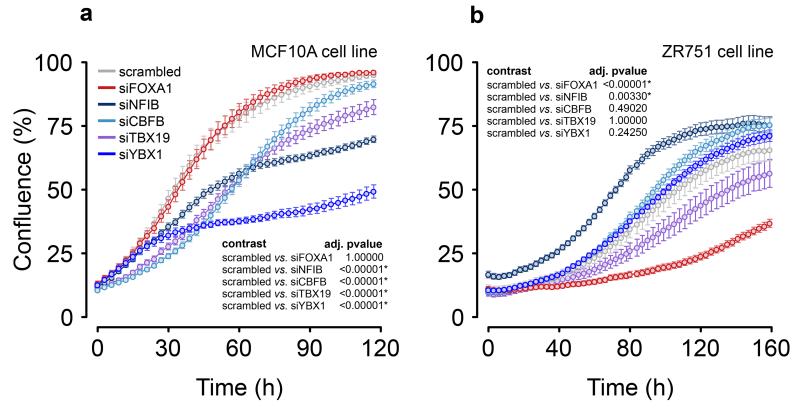
Figure 6. Effects of risk-TF knock-down on cell proliferation.
Growth curves for (a) ER− cell line MCF10A and (b) the ER+ cell line ZR751 after transient transfection of the siRNAs as indicated. Cells transfected with a scrambled siRNA were included as a control. Error bars depict the standard error of the mean of 8 wells each in a minimum of two independent experiments (methods). The statistical analysis (insets) compares the growth curves using 100,000 simulations, with p-values adjusted by the BY correction method.

