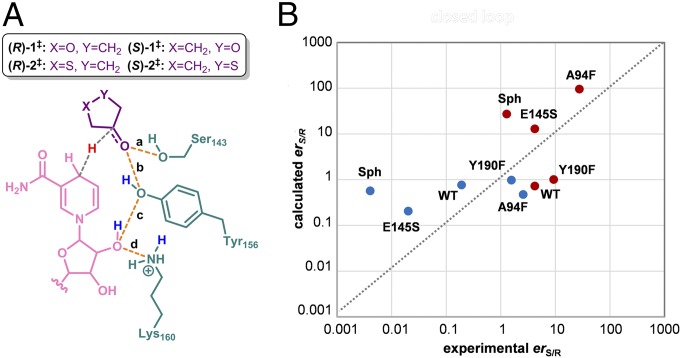
Fig. 8.
(A) Catalytic distances (a–d) monitored in the MD simulations with the theozymes. (B) Logarithmic graph of the experimental vs. computed erS/R derived from the population of the catalytically competent poses in the MD trajectories [calc. erS/R = %(S)/%(R)]. The values for 3-oxacyclopentanone and 3-thiacyclopentanone are shown in red and blue, respectively.

