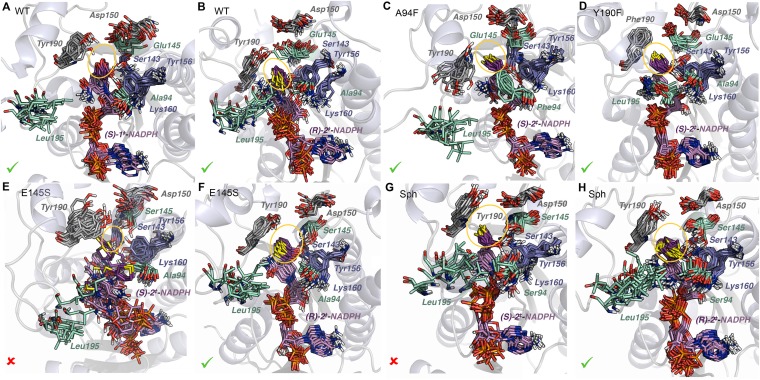
Fig. 9.
Overlays of 12 snapshots obtained along 160-ns MD simulations with TS complexes of selected KRED variants. (A) WT and (S)-1‡. (B) WT and (R)-2‡. (C) A94F and (S)-2‡. (D) Y190F and (S)-2‡. (E) E145S and (S)-2‡. (F) E145S and (R)-2‡. (G) Sph and (S)-2‡. (H) Sph and (R)-2‡. The cofactor and substrate are shown in pink and purple, respectively. The catalytic residues Ser143, Tyr156, and Lys160 are in blue; Tyr/Phe190 and Asp150 are in gray; and Leu195, Ala/Phe/Ser94, and Glu/Ser145 are in light green. The approximate extension of the active site is shown as a yellow ellipse. The stability of these TS complexes according to the preservation of the catalytic contacts throughout the MD trajectories is indicated as favored (✓) or disfavored (X).

