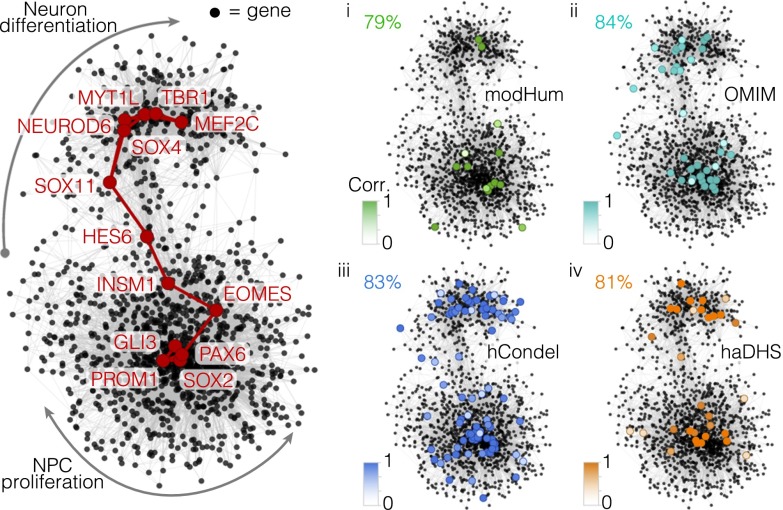
Fig. 5.
Genomic scans of disease, evolutionary, and chromatin signatures highlight genetic aspects of human corticogenesis that can be modeled in vitro. Shown is the covariation network using genes that have high correlation (>0.3) with TFs controlling the AP–BP–neuron lineage from Fig. 2C. Select TF nodes are highlighted to delineate the path. (i–iv) Panels show genes that have amino acid changes that are modHum (i, green), OMIM (ii, turquoise), hCondel (iii, blue), or haDHS (iv, orange). The percentage of cells that have a positive correlation (>0.4) between fetal and organoid cells is shown, with nodes colored based on the correlation coefficient (Dataset S4).

